LDOUSDTmy entry on this trade idea is taken from a point of interest below an inducement.. I extended my stoploss area to cover for the whole swing as price can target the liquidity there before going as i anticipate.. just a trade idea, not financial advise
LDOUST trade ideas

LDO (Lido DAO): Approaching SupportTrade setup : Price is in a downtrend, trading well below its 200-day MA. It again got rejected at a stiff resistance area of $2.60 horizontal resistance and 200-day Moving Average. Swing Traders: pullbacks near $1.50 support, which has held a few times this year, could be a swing trade entry with +25% upside potential back to $2.20. or even $2.60. Stop Loss (SL) at $1.37. This is a higher risk trade setup since the overall trend is down. Lido (LDO) is the largest DeFi platform and a leading ETH liquid staking platform (see our on-chain analytics and research report) .
Pattern : Price is Approaching Support, which is a level where it could pause or reverse its recent decline, at least temporarily. Support is often a level where price has bounced up in the past, or potentially prior Resistance level that was broken. (concept known as polarity). Once price breaks below support, it can move lower to the next support level. Learn to trade key levels in Lesson 7.
Trend : Short-term trend is Strong Down, Medium-term trend is Strong Down and Long-term trend is Strong Down.
Momentum is Bearish but inflecting. MACD Line is still below MACD Signal Line but momentum may have bottomed since MACD Histogram bars are rising, which suggests that momentum could be nearing an upswing. Price is neither overbought nor oversold currently, based on RSI-14 levels (RSI > 30 and RSI < 70).
Support and Resistance : Nearest Support Zone is $1.50. Nearest Resistance Zone is $1.75, then $2.20.

Trade Setup: LDO Long PositionMarket Context:
LDO experienced a significant sell-off due to the SEC case, bringing it down to high-time-frame (HTF) support. As one of the best ETH beta assets, there's confidence in LDO's potential, especially with anticipated ETH spot ETF flows. For a bullish scenario, ETF flows should exceed 20% of BTC inflows.
Trade Setup:
Entry: Enter a trade at support around $1.40.
Take Profit:
First target: $1.90
Second target: $2.30
Third target: $2.50
Stop Loss: Set the stop loss just below $1.25.
📊 Monitor the market closely and adjust your strategy as needed! #LDO #CryptoTrading #SupportZone 🎯

Sell posishionBy reaching the strong daily resistance range, we have the continuation of the trend and fall, which will be accessible after the first level and the first profit limit are broken.

LDO PriceIt has breached its pivot of $2 with sharp volume selloff and might continue to shed gains ahead.

LDO PriceThe Lido DAO token (LDO) price did not manage to hold the $2 mark and faced a sharp throwback in the yesterday trading session

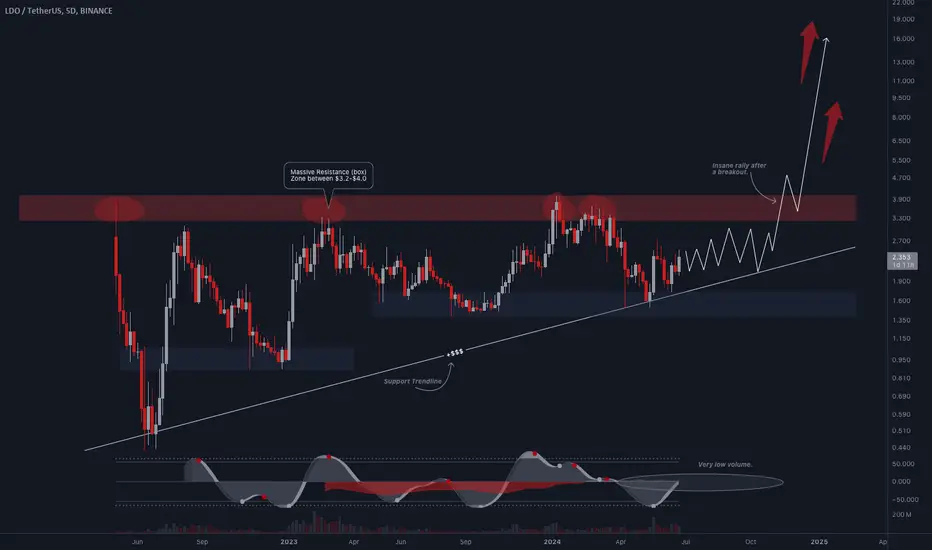
$LDO #LidoDAO Trading IdeaLDO/USD (LidoDAO) formed this massive ascending triangle pattern. Full send after a breakout. ATH is $11.00 per coin. We are good as long as this support trendline holds the price on a 5D-1W timeframe (by creating HL).
Long Idea on LDOok, I need to describe the damn thing, I came in, I just believe in the high season now (I will duplicate the description in coins that I will take)

LDO PriceThe Lido DAO (LDO) token price signifies a rebound from its bottom mark of $1.50 and escaped out of the correction phase.

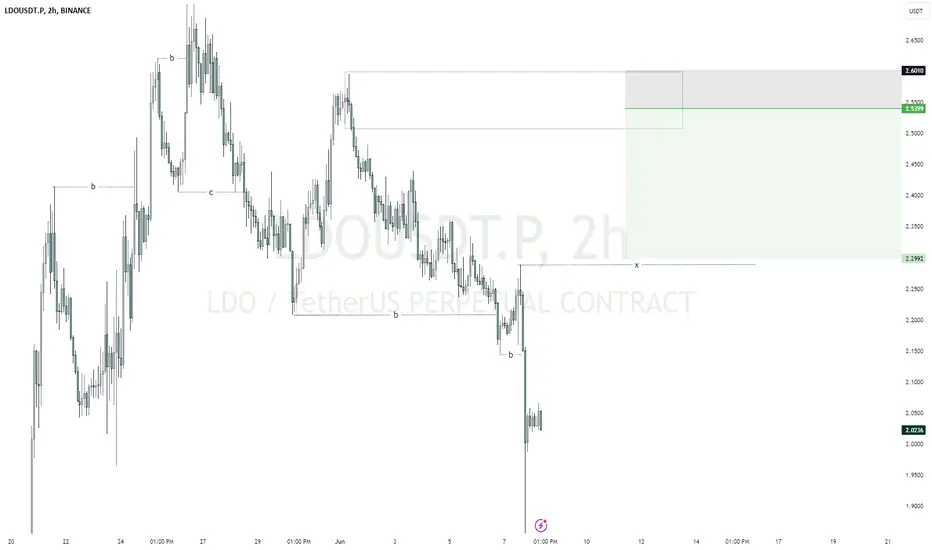
LDOUSDT | Possible Push Down?Market Context
The crypto market has been quite unpredictable lately, making it challenging to forecast short-term movements. However, I’m sensing a possible downside move for LDOUSDT.
Chart Analysis
LDO is currently hovering within an 8H supply and demand zone, which historically suggests a potential drop before any significant upward movement.
Strategy
Despite the uncertainty, the signs point towards a move lower before a pump. We’re already in the trade with an entry price of 2.3405, betting on this short-term decline.
Key Indicators
• Supply & Demand Zone: LDO is in a critical area, often leading to a price drop.
• Market Sentiment: General market unpredictability leans towards a cautious approach.
Action Plan
Let’s see if this analysis plays out. We’re set up and ready to ride the wave down if it materializes. Stay tuned for updates!

#LDO/USDT#LDO
The price is moving within a descending channel pattern on a 4-hour frame, which is a retracement pattern
We have a bounce from a green support area at 1.67
We have a tendency to stabilize above the Moving Average 100
We have a downtrend on the RSI indicator that supports the rise and gives greater momentum and the price is based on it
Entry price is 1.85
First goal 2.17
Second goal 2.42
Third goal 2.68

Will staking become the next popular track? ---- LDOConsensys said that ETH developers achieved a huge victory in SEC negotiations. The SEC will end its investigation on ETH 2.0 and will make it clear that ETH will not be considered a security. Although this will not affect the listing of ETH ETF, if the SEC acquiesces to the existence of Staking, the LSD sector will become the next hot track.
Due to regulatory pressure, the LSD sector has always been difficult to obtain mainstream funds. Even in cases such as the ETH ETF being approved earlier, the SEC still stated that it reserves the right to conduct follow-up investigations. As the main verification method of the blockchain, node staking is particularly critical. Although the current TVL of LST has reached US$53 billion, the TVL of the head protocol Lido far exceeds that of other DeFi protocols. However, LDO’s market value ranking is 43rd, which is far lower than the market value of leading protocols in other tracks. It's clearly undervalued at the moment.
It can also be seen from the candle chart that Lido's performance in the past bull market was average and almost remained in the process of fluctuation. And all this may change due to the above-mentioned events. From the TSB indicator, we can see that it has strong adaptability to LDO. After successfully judging the trend many times, the TSB indicator gave a BUY signal on June 16. Although there was an obvious callback afterwards, BUY was not covered by SELL. After that, LDO continued to rise.
Introduction to indicators:
Trend Sentinel Barrier (TSB) is a trend indicator, using AI algorithm to calculate the cumulative trading volume of bulls and bears, identify trend direction and opportunities, and calculate short-term average cost in combination with changes of turnover ratio in multi-period trends, so as to grasp the profit from the trend more effectively without being cheated.
KDMM (KD Momentum Matrix) is not only a momentum indicator, but also a short-term indicator. It divides the movement of the candle into long and short term trends, as well as bullish and bearish momentum. It identifies the points where the bullish and bearish momentum increases and weakens, and effectively capture profits.
Disclaimer: Nothing in the script constitutes investment advice. The script objectively expounded the market situation and should not be construed as an offer to sell or an invitation to buy any cryptocurrencies.
Any decisions made based on the information contained in the script are your sole responsibility. Any investments made or to be made shall be with your independent analyses based on your financial situation and objectives.

Lido DAO Ldo price holds firmly#LDOUSDT price "fell slightly" at night compared to other altos and was very well bought back.
Is there any fundamental news around MIL:LDO ? Do you know anything about it?
As long as there is "strength at buyers", you should at least pay attention to the project, and as a maximum, you should take it)
Buying zone -10% down from the current price
The growth potential is +100%.
_____________________
Did you like our analysis? Leave a comment, like, and follow to get more

Is #LDOUSDT Ready to Soar? Critical Support Levels in Play!Yello, Paradisers! Are you ready for some potential big moves with #LDOUSDT? Let's dive into the analysis to see what’s brewing!
💎#LDOUSDT is showing signs of a probable bullish continuation from a strong support zone.We have seen #LDO following a descending channel for a long time. Recently, after tapping the descending support, it’s restoring momentum at the key support level of $1.835 within the channel's trajectory.If the price successfully manages to hold momentum at this support, there is a great probability of a bullish ride, similar to previous behavior at this level.
💎If #LDO manages to break above the supply zone of $2.457, it will likely target the next resistance zone. However, if the price fails to hold momentum at the key support, we’re expecting a probable bullish rebound from the lower demand zone around $1.675.
💎 It's vital to maintain vigilance and closely observe #LDO price movements. A breakdown below the demand area, confirmed by a daily closure, would challenge the bullish scenario and could result in further declines.
💎If you want to be consistently profitable, you need to be extremely patient and always wait only for the best, highest probability trading opportunities.
Stay focused, patient, and disciplined, Paradisers!
MyCryptoParadise
iFeel the success🌴

LDO PriceThe Lido DAO token (LDO) price has surpassed the 20 day EMA mark and reverted from its prompt support mark of $1.80. It has pumped over 17% and signifies buyer accumulation this week.

LDO Price
A double bottom formation was noted on its charts and it might settle there and see a rebound soon.

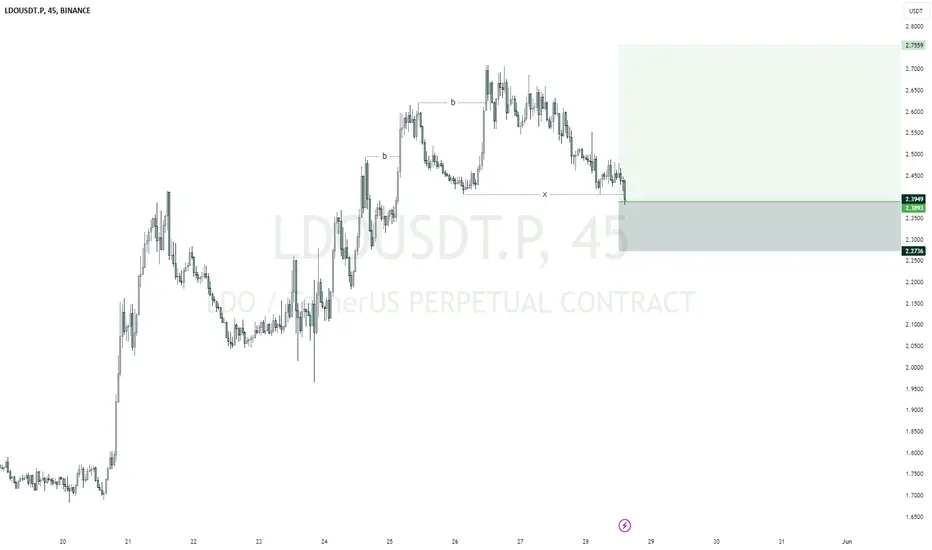
FVG and Demand And Supply Zone'sIn This chart I have specified and given a detailed zone of Demand and Supply Zone's and FVG's.

LDOUSDTMy entry on this trade idea is taken from a point of interest ABOVE an inducement.. I extended my stoploss area to cover for the whole swing as price can target the liquidity there before going as i anticipate.. just a trade idea, not financial advise
LDO Approaching Key Levels: Crucial Decisions Ahead🔍LDO is nearing important support and resistance levels. Here's an analysis to help you navigate potential trading opportunities.
📆Coin of the Day: LDO (Lido DAO)
About the Project
Lido DAO is a decentralized autonomous organization that provides liquid staking services for various proof-of-stake blockchains.
🧩Technical Analysis
4-Hour Timeframe
This analysis is tailored for futures trading, examining multiple scenarios.
📉Support and Resistance: The price is currently hovering around the 0.382 Fibonacci retracement level at 2.229, which aligns with the key support level at 2.219. We also have a double top pattern, making the break of 2.219 a critical point to watch.
📈Bullish Scenario: Should the price bounce off the 2.219 support level, the next resistance levels to watch are 2.301 (a riskier entry point) and the main triggers at 2.556 and 2.650. A move above these levels could signal a strong bullish trend. Confirmations from the RSI breaking above 46.22 would be beneficial.
📉Bearish Scenario: If the price breaks below 2.219, it could indicate a continuation of the downward trend. The RSI level at 37.09 and below could confirm this bearish momentum. Watch for further support around the 0.618 Fibonacci level at 2.005.
📊Volume and Moving Average: The 25-period SMA is indicating a bearish momentum. Volume is also a key factor here; a significant increase in volume could support either a strong breakout or breakdown.
👨💻Trading Positions
Long Position
Entry Trigger: Break above 2.301 for a riskier entry, or above 2.556 and 2.650 for more confirmation.
Strategy: Open a position on the break of these levels and wait for confirmation from the price action to set targets. Adjust stop-loss orders based on market conditions.
Short Position
Entry Trigger: Break below 2.219
Strategy: Open a position if the price breaks below this critical support level, targeting lower levels such as 2.005. Adjust stop-loss orders to manage risk.
📝LDO is approaching key support and resistance levels, with significant implications for future price movements. Traders should monitor breaks of these levels to open positions. RSI and SMA indicators provide additional confirmation for momentum. Volume analysis suggests that a significant move could be imminent. Long positions should be considered above 2.301, with main triggers at 2.556 and 2.650, while short positions should be approached if the price breaks below 2.219.
🧠💼Always remember the inherent risks in futures trading, with the potential for margin calls if risk management is neglected. Stick to strict capital management principles and use stop-loss orders, ensuring an initial target with a risk-to-reward ratio of 2.
🫶If you found this analysis helpful and want to support me, please boost this analysis. Feel free to leave a comment or suggest a coin you'd like me to analyze next.

Lido Dao looks painfully BearishA recent chart analysis based on the 4-hour candlestick shows a bearish engulfing pattern.
This pattern is a strong sell signal, indicating that if the current support level fails to hold, further decline is expected.
Specifically, if the current price level breaks down, it is likely to drop to $1.50. With trading volume increasing and selling pressure mounting, investors need to closely monitor the market situation.
If the $1.50 support level does not hold, a continued downtrend may ensue. Therefore, considering a short position in the short term might be advisable.
As the overall market sentiment is turning bearish, a cautious investment strategy is necessary.

ldo usd short signalLiq the fuel that moves the market
Carefully looking at the chart you will see that there is not enough liq to push the market up and that why the bears are taking control
Since the bears are in control for the short term a short signal to a buy poi wont be bad
Why the sell signal?
Market needs liq and it needs to take out all internal liq to be able to move higher

LDOUSDTmy entry on this trade idea is taken from a point of interest BELOW an inducement.. I extended my stoploss area to cover for the whole swing as price can target the liquidity there before going as i anticipate.. just a trade idea, not financial advise
LDO LDO / USDT
After the current weekly behavior it looks extremely bullish in mid term
Targeting at least the upper resistance line of the ascending channel pattern and more fuel if we breakout it
Note : this coin has a relation to ETH and with ETH ETF approved it added more fuel to it
