LEVERUSDT trade ideas

LEVERUSDT 1D AnalysisLEVER ~ 1D Analysis
#LEVER This trade is very risky. Buy if you still have confidence in this coin with a short term target of at least 15%+ from this support.

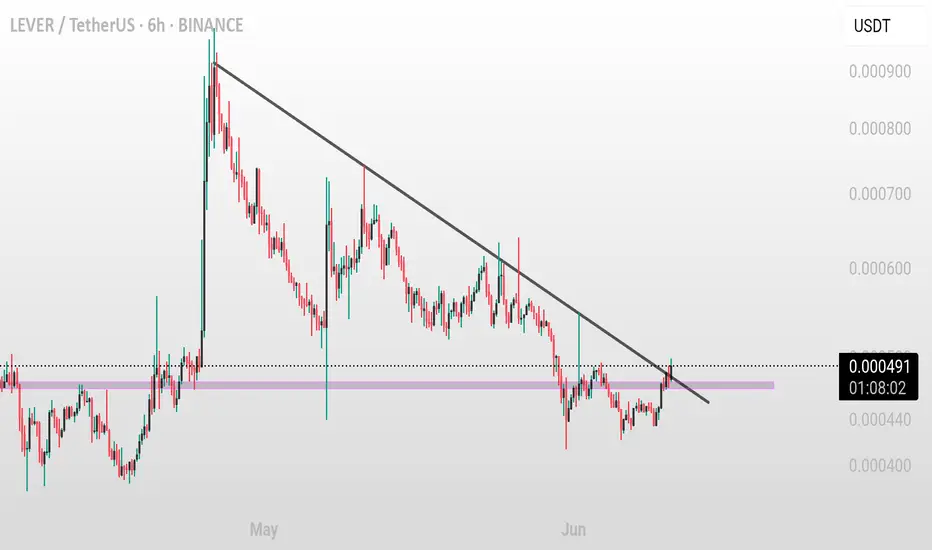
LEVER/USDT (6H) – Trendline Breakout in Progress LEVER/USDT (6H) – Trendline Breakout in Progress
Pattern: Descending Trendline Breakout
Timeframe: 6-Hour ⏱️
Pair: LEVER/USDT 💱
Published: June 10, 2025 📅
Technical Overview:
LEVER/USDT has been trading under a consistent downward trendline, making lower highs over several weeks. Price is now attempting a breakout above this resistance, showing signs of reversal and bullish momentum 📈
Potential Trade Setup:
Bullish Scenario ✅
Entry: On breakout and 6H candle close above 0.000520–0.000530
Targets:
* TP1: 0.000650–0.000680 🎯
* TP2: 0.000750–0.000800 🎯
Stop-loss: Below 0.000450–0.000460 🛑
Risk Management ⚠️
Wait for confirmation with strong candle close and volume to avoid fakeouts. If rejected, price may resume its downtrend or consolidate further.
Conclusion:
LEVER is testing a key resistance zone. Break and hold above trendline may confirm a trend reversal with upside potential 📊🔍
LEVER Looks Bullish (4H)The structure of the Lever symbol has turned bullish.
Within the internal substructure, we are looking for buy/long opportunities.
We have identified and marked two optimized entry points on the chart. These are the levels where we plan to open positions.
Target levels have been set.
A daily candle closing below the invalidation level will invalidate this analysis.
Do not enter the position without capital management and stop setting
Comment if you have any questions
thank you

LEVER price ACTION #Reversal #BullIt's very likely lever will deliver bullish price candle this week or within two days

LEVERUSDT 5DLEVER ~ 5D Analysis
#LEVER Buy gradually from here with a short -term target of at least 20%+.

Lever Spot trade Hellow Traders,
Please see chart for details. I generally do a better explanation but, this one is pretty straight forward make sure you check our linked trades and tags on this post for more free trade set ups!!
Hope to see you with all of us together soon!
Stay profitable folks!
Savvy!!

LEVER/USDTKey Level Zone: 0.0013690 - 0.0013870
HMT v5 detected. The setup looks promising, supported by a previous upward/downward trend with increasing volume and momentum, presenting an excellent reward-to-risk opportunity.
HMT (High Momentum Trending):
HMT is based on trend, momentum, volume, and market structure across multiple timeframes. It highlights setups with strong potential for upward movement and higher rewards.
Whenever I spot a signal for my own trading, I’ll share it. Please note that conducting a comprehensive analysis on a single timeframe chart can be quite challenging and sometimes confusing. I appreciate your understanding of the effort involved.
Important Note :
Role of Key Levels:
- These zones are critical for analyzing price trends. If the key level zone holds, the price may continue trending in the expected direction. However, momentum may increase or decrease based on subsequent patterns.
- Breakouts: If the key level zone breaks, it signals a stop-out. For reversal traders, this presents an opportunity to consider switching direction, as the price often retests these zones, which may act as strong support-turned-resistance (or vice versa).
My Trading Rules
Risk Management
- Maximum risk per trade: 2.5%.
- Leverage: 5x.
Exit Strategy
Profit-Taking:
- Sell at least 70% on the 3rd wave up (LTF Wave 5).
- Typically, sell 50% during a high-volume spike.
- Adjust stop-loss to breakeven once the trade achieves a 1.5:1 reward-to-risk ratio.
- If the market shows signs of losing momentum or divergence, ill will exit at breakeven.
The market is highly dynamic and constantly changing. HMT signals and target profit (TP) levels are based on the current price and movement, but market conditions can shift instantly, so it is crucial to remain adaptable and follow the market's movement.
If you find this signal/analysis meaningful, kindly like and share it.
Thank you for your support~
Sharing this with love!
HMT v2.0:
- Major update to the Momentum indicator
- Reduced false signals from inaccurate momentum detection
- New screener with improved accuracy and fewer signals
HMT v3.0:
- Added liquidity factor to enhance trend continuation
- Improved potential for momentum-based plays
- Increased winning probability by reducing entries during peaks
HMT v3.1:
- Enhanced entry confirmation for improved reward-to-risk ratios
HMT v4.0:
- Incorporated buying and selling pressure in lower timeframes to enhance the probability of trending moves while optimizing entry timing and scaling
HMT v4.1:
- Enhanced take-profit (TP) target by incorporating market structure analysis
HMT v5 :
Date: 23/01/2025
- Refined wave analysis for trending conditions
- Incorporated lower timeframe (LTF) momentum to strengthen trend reliability
- Re-aligned and re-balanced entry conditions for improved accuracy

Lever Bullish It signals a bullish trend is upcoming for a lever , I expect a massive bullish candle from this level

LEVERUSDT 5DLEVER ~ 5D
#LEVER if you still have Conviction on this coin,. Buy in stages from here with a minimum target of 20%++

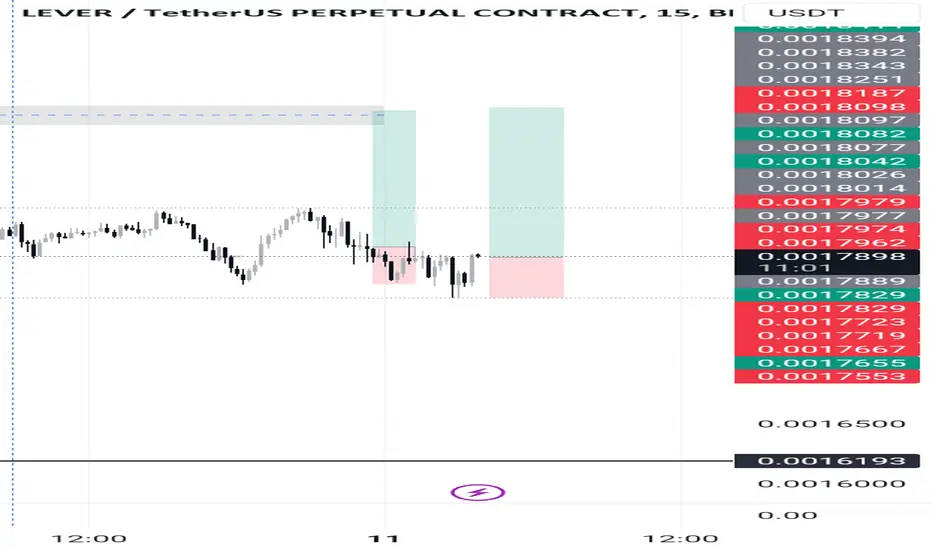
LEVERUSDT Analysis: Strong Demand Zone IdentifiedThe blue box on the chart marks a significant demand zone , presenting a favorable opportunity for buyers.
Key Insights:
Demand Zone Potential: The blue box is a carefully chosen area with high potential for a market reaction, identified using techniques like volume footprint, liquidity heatmaps, and cumulative delta volume.
Entry Strategy: This zone aligns well for a potential buy setup if confirmation signals appear.
Market Context: Current market conditions demand patience and precise entries.
Confirmation Checklist:
Before taking a position, I will confirm using:
Cumulative Delta Volume (CDV)
Liquidity Heatmap
Volume Profile
Volume Footprint
Upward Market Structure Breaks on Lower Time Frames
Learn Trading Techniques:
Interested in learning how to identify and trade demand zones effectively? DM me for training on using CDV, liquidity heatmaps, volume profiles, and other professional tools.
Final Words:
Discipline and risk management are crucial in this volatile market. Stick to the plan and trade wisely. Best of luck!
If you think this analysis helps you, please don't forget to boost and comment on this. These motivate me to share more insights with you!
I keep my charts clean and simple because I believe clarity leads to better decisions.
My approach is built on years of experience and a solid track record. I don’t claim to know it all, but I’m confident in my ability to spot high-probability setups.
If you would like to learn how to use the heatmap, cumulative volume delta and volume footprint techniques that I use below to determine very accurate demand regions, you can send me a private message. I help anyone who wants it completely free of charge.
My Previous Analysis (the list is long but I think it's kinda good : )
🎯 ZENUSDT.P: Patience & Profitability | %230 Reaction from the Sniper Entry
🐶 DOGEUSDT.P: Next Move
🎨 RENDERUSDT.P: Opportunity of the Month
💎 ETHUSDT.P: Where to Retrace
🟢 BNBUSDT.P: Potential Surge
📊 BTC Dominance: Reaction Zone
🌊 WAVESUSDT.P: Demand Zone Potential
🟣 UNIUSDT.P: Long-Term Trade
🔵 XRPUSDT.P: Entry Zones
🔗 LINKUSDT.P: Follow The River
📈 BTCUSDT.P: Two Key Demand Zones
🟩 POLUSDT: Bullish Momentum
🌟 PENDLEUSDT.P: Where Opportunity Meets Precision
🔥 BTCUSDT.P: Liquidation of Highly Leveraged Longs
🌊 SOLUSDT.P: SOL's Dip - Your Opportunity
🐸 1000PEPEUSDT.P: Prime Bounce Zone Unlocked
🚀 ETHUSDT.P: Set to Explode - Don't Miss This Game Changer
🤖 IQUSDT: Smart Plan
⚡️ PONDUSDT: A Trade Not Taken Is Better Than a Losing One
💼 STMXUSDT: 2 Buying Areas
🐢 TURBOUSDT: Buy Zones and Buyer Presence
🌍 ICPUSDT.P: Massive Upside Potential | Check the Trade Update For Seeing Results
🟠 IDEXUSDT: Spot Buy Area | %26 Profit if You Trade with MSB
📌 USUALUSDT: Buyers Are Active + %70 Profit in Total
🌟 FORTHUSDT: Sniper Entry +%26 Reaction
🐳 QKCUSDT: Sniper Entry +%57 Reaction
📊 BTC.D: Retest of Key Area Highly Likely
I stopped adding to the list because it's kinda tiring to add 5-10 charts in every move but you can check my profile and see that it goes on..

TradeCityPro | LEVERUSDT Analysis Buyer Presence👋 Welcome to the TradeCityPro channel!
Let’s dive into the analysis of another cryptocurrency and review our triggers before the movement begins.
🌍 Bitcoin's Market Overview
Yesterday, we mentioned that a long position could be opened after breaking 94931, especially if Bitcoin's dominance was declining, favoring altcoins.
After a pullback to 94931, the price is now approaching 96610, where breaking this level could provide another long position opportunity. If Bitcoin's dominance continues to fall, altcoins like LEVERUSDT could see further upward momentum.
📊 Weekly Timeframe
LEVERUSDT is consolidating in a long-term range between 0.001123 and 0.003877, with a narrower short-term range between 0.001588 and 0.002317.
Following rejection from the top of the range, the price didn't drop to the bottom of the box, finding support earlier. This indicates buying strength.
breakout above 0.002317 could signal a risky buying opportunity with stop-loss levels at 0.001588 or 0.001123 for a medium-term hold.
📈 Daily Timeframe
The price has been ranging between 0.001518 and 0.002405, repeatedly testing the upper resistance.
The daily red candles rejecting resistance highlight its importance. A sharp breakout above this level could trigger a significant move.
After breaking this resistance, buyers can enter. If missed, confirmation through RSI breaking 70.13 and rising volume could provide additional confidence.
⏱ 4-Hour Timeframe
The price has shown strong movement toward the range's upper resistance, suggesting this coin might present trading opportunities this week.
For long positions, wait for a breakout above 0.002405, coupled with RSI entering overbought territory and breaking 70.13 for confirmation.
Avoid looking for short positions as the trend appears bullish. Instead, focus on potential entries at lower levels.
📝 Final Thoughts
Stay calm, trade wisely, and let's capture the market's best opportunities!
This analysis reflects our opinions and is not financial advice.
Share your thoughts in the comments, and don’t forget to share this analysis with your friends! ❤️

LEVERFI WILL DROP 30%This BINANCE:LEVERUSDT shows a continuing downward sloping channel.
Observe that the support has been bridged trice. while price have only ticked resistance without piercing through.
The idea is to short at the top of the channel (red line) even if price break above redline, the purple channel provides another strong resistance.
Action plan
0.002258- 0. 002180 -- sell
0.002530 -0.002656 -- Stop loss
0.001450- 0.00168 -- take profits
Goodluck!!

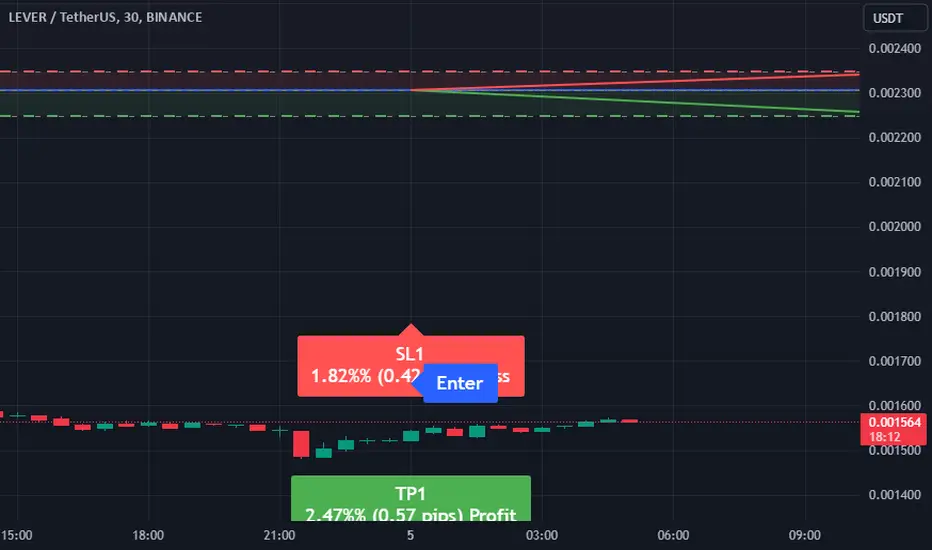
Trading Signal for LEVERUSDTDear Traders,
We are issuing a new trading signal for the LEVERUSDT pair. Below are the details for your action:
Direction: Sell
Enter Price: 0.002305
Take Profit: 0.002248
Stop Loss: 0.002347
Analysis:
This sell signal is generated using our proprietary EASY Quantum Ai strategy. Several indicators have contributed to this decision:
1. Market Momentum : Recent analysis shows a weakening momentum in the LEVERUSDT pair, indicating potential downward pressure.
2. Technical Indicators : Technical patterns reveal bearish signals with increased selling volume over recent sessions.
3. Resistance Levels : The pair is struggling to break through established resistance levels, reinforcing a bearish outlook.
4. Market Sentiment : The general sentiment around this pair has shifted, with traders showing caution on upward movements.
5. Risk Management : The defined Stop Loss at 0.002347 and Take Profit at 0.002248 are designed to ensure potential gains while managing risks effectively.
Please remember that all trading involves risk, and ensure you conduct your own further research before acting on this signal. Stay informed and trade wisely!
Best regards,
Your Trading Strategy Team
LEVERUSDTLEVER ~ 1W
#LEVER If this Support block is retested again. Don't hesitate to buy. So far this support block continues to maintain prices.
minimum target 20%++


Lever long I'm in a long position on Lever trade, hoping for good profits. It's advisable to take partial profits along the way.

Lever I am long on lever because it is showing signs of a strong bullish sign and it finish retracment

LeverFi: 95% Short-Term MoveSome charts focus on the long-term, others mid-term and others short-term.
Some charts are bearish, some are neutral while others are bullish.
Here we are looking at LeverFi (LEVERUSDT) anticipating a short-term bullish move.
In our terminology, short-term means within 30 days. This can be a long time for a lot of people but for us this is quite fast as we use a patience and anxiety free method of trading. We can buy, wait patiently and collect profits. There is no hurry, no rushing around; endless opportunities. If one goes/is missed, another one shows up.
We are approaching this one with a very tight stop-loss.
This can be a leveraged trade.
➖ Technical Analysis
We have a major correction followed by a long-term higher low. We have some consolidation with slowly rising prices, with see other pairs moving ahead and we think this one can produce a sudden bullish jump.
Good risk reward ratio.
The risk is less than 10%.
Growth potential goes beyond 100%.
Thank you for reading.
I am wishing you profits, health, wealth and success.
Make sure to hit follow.
Namaste.


Lever bout to pump One last entry before the lever heads to the moon, as it’s very bullish on all time frames.

LEVERUSDTLEVER ~ 1W ✅
#LEVER If this Key Support is retested again. Don't hesitate to buy. So far this support block continues to maintain prices.
