LEVERUSDT trade ideas

Lever long I'm in a long position on Lever trade, hoping for good profits. It's advisable to take partial profits along the way.

Lever I am long on lever because it is showing signs of a strong bullish sign and it finish retracment

LeverFi: 95% Short-Term MoveSome charts focus on the long-term, others mid-term and others short-term.
Some charts are bearish, some are neutral while others are bullish.
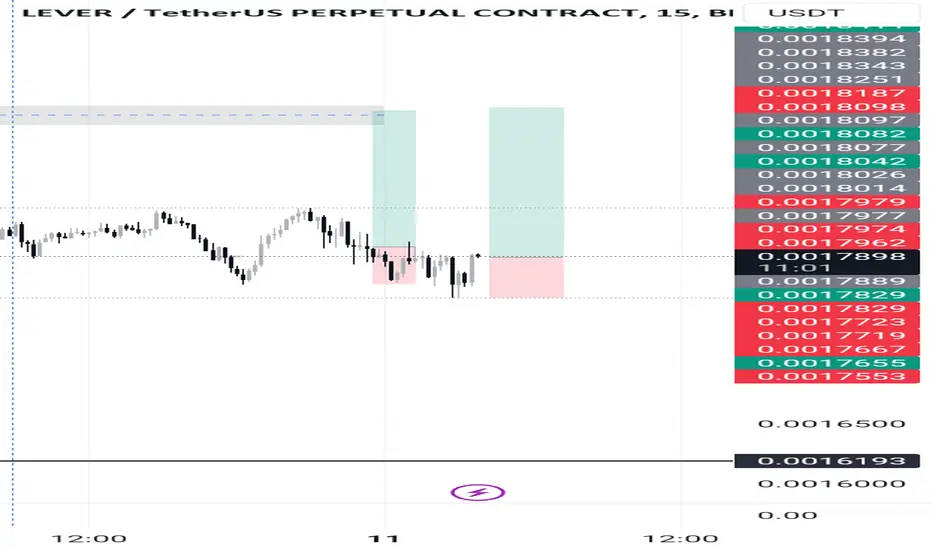
Here we are looking at LeverFi (LEVERUSDT) anticipating a short-term bullish move.
In our terminology, short-term means within 30 days. This can be a long time for a lot of people but for us this is quite fast as we use a patience and anxiety free method of trading. We can buy, wait patiently and collect profits. There is no hurry, no rushing around; endless opportunities. If one goes/is missed, another one shows up.
We are approaching this one with a very tight stop-loss.
This can be a leveraged trade.
➖ Technical Analysis
We have a major correction followed by a long-term higher low. We have some consolidation with slowly rising prices, with see other pairs moving ahead and we think this one can produce a sudden bullish jump.
Good risk reward ratio.
The risk is less than 10%.
Growth potential goes beyond 100%.
Thank you for reading.
I am wishing you profits, health, wealth and success.
Make sure to hit follow.
Namaste.


Lever bout to pump One last entry before the lever heads to the moon, as it’s very bullish on all time frames.

LEVERUSDTLEVER ~ 1W ✅
#LEVER If this Key Support is retested again. Don't hesitate to buy. So far this support block continues to maintain prices.


LEVER Bullish?Lever shows bullish divergence, suggesting a potential upward movement from this level.

Lever quick scalpingLever rejected from 4-hour OB, prompting me to go short.
TP 1 : THE LIGHT BLUE TRENDLINE


Hello tradersLever stop me out on the previous trade I expect the price to pullback from here . If not I will look out for a long when it breaks out resistance convincingly 👆 🌈


LEVER ANALYSIS🚀#LEVER Analysis :
🔮#LEVER is trading in a symmetrical triangle pattern on the daily timeframe Also there is an instant support zone💁♂️
We could expect a breakout of the symmetrical triangle pattern and could expect a potential bullish move📈
Expect a bullish wave of around 25% in the coming weeks
🔰Current Price: $0.001865
🎯 Target Price: $0.002310
⚡️What to do ?
👀Keep an eye on #LEVER price action. We can trade according to the chart and make some profits⚡️⚡️
#LEVER #Cryptocurrency #TechnicalAnalysis #DYOR

Lever/Usdt BINANCE:LEVERUSDT
Lever (LEVER) is currently trading at $0.002054 and has recently tested a significant support level at $0.001900. This support level is crucial for maintaining the current price trend. If the price holds above $0.001900, it indicates that buying interest is sufficient to prevent further declines.
Should the price stay above this support and begin to rise, the next key resistance level to watch is $0.002300. This level could act as a barrier to further upward movement. If the price breaks through this resistance level, it would suggest a bullish trend, potentially leading to a breakout.
Upon breaking the $0.002300 resistance, the subsequent target would be $0.002400. If this level is also surpassed, the price could continue to rise towards the next major resistance at $0.02734. This would indicate a significant upward momentum and a strong bullish pattern.
In summary, the key points are:
- **Support Level:** $0.001900
- **Resistance Levels:** $0.002300, $0.002400
- **Potential Next Resistance:** $0.02734
**Note:** This analysis is based on current price levels and historical patterns and should not be considered financial advice. Always conduct your own research or consult with a financial adviser before making investment decisions.

#LEVER/USDT is trying to break the Diagonal Trendline in 1-hour #LEVER/USDT is trying to break the Diagonal Trendline in 1-hour TF!
Wait for the breakdown and retest to long $LEVER. The local support level is PML $0.0018395 and the resistance level is PWH $0.0023693.


Will #LEVERUSDT Defy the Odds or Dive Deeper? Watch These LevelsYello, Paradisers! Is #LEVERUSDT about to take off, or are we in for another twist? Let's look at the latest analysis of the #LeverFi:
💎#LEVER is currently flashing signs of a bullish continuation from a key support zone that used to be a descending resistance. We've been tracking #LeverFi moving within a descending channel for a while now. Recently, it broke above this pattern, retested the upper channel, and is now showing strength at the crucial support level.
💎If #LEVER holds this support, we could see a significant bullish rally reminiscent of past trends. A breakout above the resistance at $0.0026 could pave the way for a move towards higher resistance zones.
💎Should the momentum fail to sustain at the current level, the next bullish rebound might occur around the lower bullish Order Block (OB) at $0.0015. If that fails, we may see further support tested at $0.0013.
💎Stay vigilant, Paradisers! A daily close below the demand area could negate the bullish scenario and lead to a deeper correction.
Stay focused, patient, and disciplined, Paradisers🥂
MyCryptoParadise
iFeel the success🌴
