Lever Correction IncomingThis coin rally with no or little correction so I do think that for healthy growth their must be a reasonable retracement before upside move
LEVERUSDT trade ideas

Lever/Usdt Plan The Lever/USDT pair shows promise for a breakout. With increased volume, it may significantly rise. Keep an eye on it as I anticipate a strong breakout in the coming days. Please note that this is not financial advice; do your own research before making any decisions.

LEVERUSDT Is Critical Levels to Watch!!Yello, Paradisers! Are we on the brink of a significant move in #LEVERUSDT? Let's dive in.
💎#LEVER is currently showing signs of a successful breakout from the falling wedge pattern—a bullish signal that suggests upward momentum. However, the current price action is testing the resistance zone at 0.0019 - 0.00204 and has faced rejection. If LEVER fails to break out above this resistance soon, we could see the price retracing to the demand zone at 0.00159 to gather momentum for another attempt.
💎Should LEVER manage to break through the 0.00204 resistance, there's a high probability that the price will quickly reach the first target area. If it also overcomes resistance at that level, we could witness a significant upward move towards our final target within a strong resistance zone.
💎However, the bearish scenario comes into play if LEVER tests the demand zone but fails to bounce. If this occurs, the price is likely to break down further, heading towards the last support area at 0.00134.
💎The bullish outlook will be invalidated if we see a daily candle close below the key support area. If this happens, it would confirm a continuation of the downward trend, signaling a deeper dip.
Remember, in trading, staying disciplined is key.
MyCryptoParadise
iFeel the success🌴


Lever poised for Bullish MoveLever is making higher high & lower lows & breaks structure which is a good signal to go long


Lever scalpingAnother entry on Lever .Based on the bearish divergence, I have taken a short position on lever.


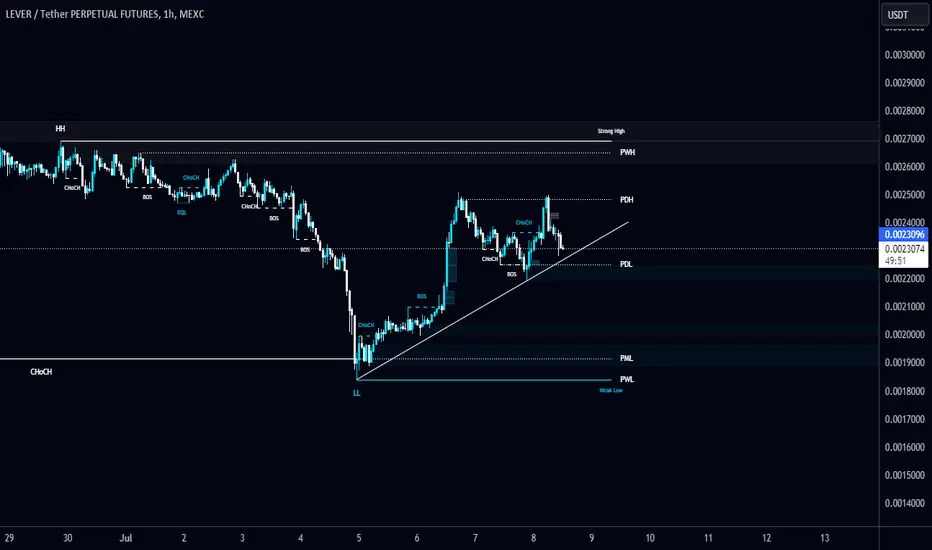
#LEVER/USDT is heading towards the Diagonal Trendline in 1-Hour #LEVER/USDT is heading towards the Diagonal Trendline in 1-Hour TF!
Wait for breakdown and retest to short $LEVER. The local support level is PDL $0.00225 and the resistance level is PDH $0.002485.
$LEVER USDT Long Set Up$LEVER pumped and we have a pull back on 1H time frame to 0.382 fib. I have my entry / buy stop at 0.002383. Good Luck
Entry 0.002383
Stoploss 0.002250
TP-1 0.002519
TP-2 0.002651

LEVERUSDT | Another Shot at the Moon?Market Context
Yesterday’s trade on LEVERUSDT was almost a win, but we got stopped out just before the price shot up. Let’s not miss out this time!
Chart Analysis
• Bullish Momentum: LEVERUSDT showed strong potential for an upward move, and despite yesterday’s stop out, the bullish signals remain intact.
• Demand Zone: The demand zone we identified is still a prime spot for entering a long position.
Strategy
I’m going long from the demand zone once again, confident that today’s move will play out in our favor. The setup is too promising to pass up!
Action Plan
Re-entering at the demand zone, ready to capitalize on the bullish momentum. Let’s hit that profit target this time and ride the wave to the top!
Let’s go, traders! 🚀📈

LEVERUSDT | Gearing Up for a Move?Market Context
Could we see a bullish run for LEVERUSDT? With Bitcoin showing signs of recovery, the stars might be aligning for LEVERUSDT to make an upward move.
Chart Analysis
• Promising Weekly Candle: The weekly close on LEVERUSDT looks very bullish, suggesting potential upward movement.
• Daily Timeframe: We’ve recently broken the structure and jumped from an interesting order block (OB) on the daily chart, signaling a possible move up.
• 5M Timeframe: There’s an intriguing demand zone on the 5-minute chart where the price could dip before soaring higher.
Strategy
I’m setting my order at this demand zone, ready to catch the upward wave once it hits. This setup looks ripe for a breakout, and I don’t want to miss it!
Action Plan
With a promising weekly close and a strong support structure, I’m going long on LEVERUSDT. Placing my order in the demand zone on the 5M timeframe—let’s see if we ride this wave to new highs!

Lever LONGIt's a good bet to go long at this level as the lever is on an uptrend line. I will take profits on the 4-hour timeframe.

LEVER, getting ready to revisit X2 price!LEVER recently went parabolic on the 1st week of October by peaking at 0.30 range. From thereon, as per the usual parabolic case which warrants a hefty correction, the coin dip dives into 0.12 territory.
At present, LEVER is slowly building a good solid base and slowly crawling up based on recent daily metrics. Seven days of straight net buying activity has been registered conveying the current price range as the new base for the next series of ascend.
The coin is bouncing off a very strong major order block support with precision.
Expect some weighty price movement from here on favoring the bulls.
We are now at a good discounted range. It's not always you get a good setup like this one. SEED.
Spotted at 0.001400
TAYOR.
Safeguard funds always.

Lever moon Price of lever is on bullish side as it makes higher high on all time frame.. i will be taking profit on consquent encroachment


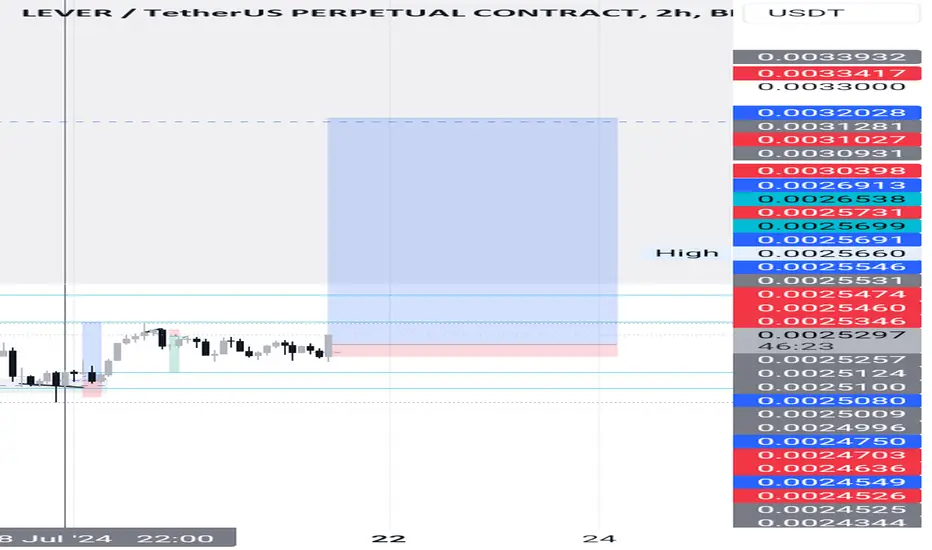
LEVERUSDT | Ready to Move Lower?Market Context
Is LEVERUSDT set to dip from this point? The signs are there!
Chart Analysis
We couldn't establish a new high on the daily chart, even with decent trading volume. This setup suggests a potential move lower, presenting an exciting quick trade opportunity.
Strategy
With strong volume but failing to break higher, I’m betting on a downward move. This trade could play out swiftly, so let's see how it unfolds!
Stay tuned—this could get interesting fast!

#LEVER/USDT#LEVER
The price is moving within an ascending channel pattern on a 1-day frame, which is a retracement pattern
We have a tendency to stabilize above the Moving Average 100
We have a downtrend on the RSI indicator that supports the rise and gives greater momentum and the price is based on it
Entry price is 0.003500
The first target is 0.004921
The second goal is 0.005501
The third goal is 0.006183

LEVERUSDT(LeverFi) Daily tf Range Updated till 11-06-24LEVERUSDT(LeverFi) Daily timeframe range. while market is having hard time today compare to that its holding nicely till now. trying to get out of 0.003990 but its a strong resistance. and not very far away from price discovery, good trade opportunity their if that happens. recent retrace point at 0.003007.

LEVERUSDT-Breaking Ascending TriangleHello
Lets Tak About #LEVERUSDT
The Ascending Triangle Breakout Has Already Done ✅
Bullish Move of 85% is expected

#LEVER/USDT is trying to break the diagonal trendline in 1-Hour #LEVER/USDT is trying to break the diagonal trendline in 1-Hour TF!
Wait for a successful BO/retest to long $LEVER. The local resistance level is PWH $0.009855.
