LINKBTC trade ideas


Considering the patternEstablished support and resistance lines. Pattern following nicely. Certainly interested.

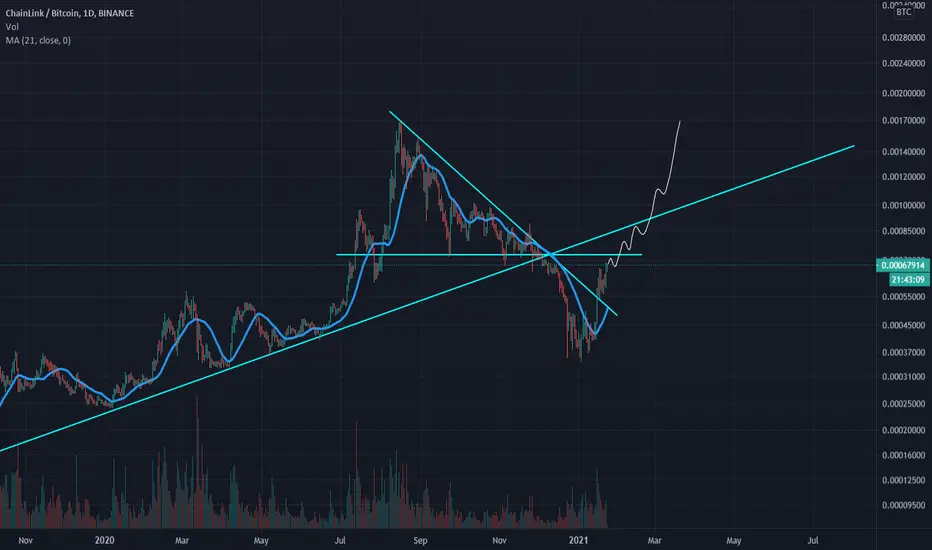
LINK / BITCOIN: 0.001+LINK / BITCOIN
This pattern confirms as a valid one when the price closes above the resistance line.


Link maybe shortThe Chart LINKBTC form a descending triangle and MACD is falling. Also BTCUSD not good so in LINKUSD chart, There's a possibility that it breaks ascending support line.

CHADLINK PARABOLIC TRENDLINE RECLAIMIf we hold above the parabolic trend line, you know where we are going ;)
Chainlink, however, faces tough resistance, from here to 94-104keks where we will need sustained knocks at the supply zone. If successful, new ATHs will be in sight. If however, we do not hold and consolidate nicely above the previous supply zone at 70keks, then it could be start of a lower high lower low structure.

64-70keks has to hold, if not rekt.It's a very simple game now. Demand zone at 64k-70k. If it doesn't hold we are going to see 38k again. If it holds and consolidates nicely we get to test 94k ish. Pray for chainlink.
LINK MARINES RISE UP


LINK/BTC Moment of TruthMoving beautifully through the channel on LINKUSD pair. If it breaks resistance here it will sky.


Resistance at 66-70keks, consolidation neededTA:
As we can see, there is a daily resistance supply zone from 64keks to 70keks, with the 20day ma also acting as resistance which gives confluence. As such chadlink has to consolidate for awhile, before it can swiftly reclaim the 20day ma to break resistance of the supply zone at 64keks to flip it into a support zone. Doing so will reclaim the parabolic trend line and will ensure that we see 180keks at least for a new linkbtc ath.
Fundamentals wise:
Staking is expected to launch Q1 of 2021, and whales are accumulating which decreases supply in exchanges. Decreased supply I exchanges will make it easier for pumps.
What to do:
HODL


ChainLink (LINK) Moving Higher (160%+ Mapped)ChainLink (LINKBTC) is looking more than ready to grow strong.
We just looked at the ATOMBTC chart and this one is very similar...
First, we have the broken downtrend (you could also draw a descending channel here).
Second, we have prices moving above EMA10, EMA21, and EMA50... In this case, LINKBTC is also above EMA100 signaling additional strength.
With the MACD on the bullish zone and the RSI ultra-strong (above 60), it is clear that ChainLink is ready for sustained growth.
Thanks a lot for your support.
Namaste.

LINKBTC | Long Position on Support LineIt's clear LINKBTC is currently at an important support zone.
Risk/Reward is high and therefore I'm taking this long position.
Another option is to trade the weekly chart and place a stop-loss at 59500-ish sats. I'm however aiming for the short-term bounce here.

20% up from last buycall - Link ready to 2x in few weeks?Hope u bought.
Stopploss under trendline - red.
modern


Crypto|LINK/BTC|LongLong LINK/BTC
Activation of the transaction only when the blue zone is fixed/broken.
The idea is to work out the local resistance level and work out the reversal pattern "W".
The "forecast" tool is used for more noticeable display of % (for the place of the usual % scale) of the price change, I do not put the date and time of the transaction, only %.
Blue zones - activation zones.
Green zones - take zones.
The red zone - the stop zone.
Working out the stop when the price returns to the level after activation + fixing in the red zone.
Orange arrow - the direction of take.
Blue arrow - neutral scenario without activating the trade.
The red arrow - the direction of the stop.
