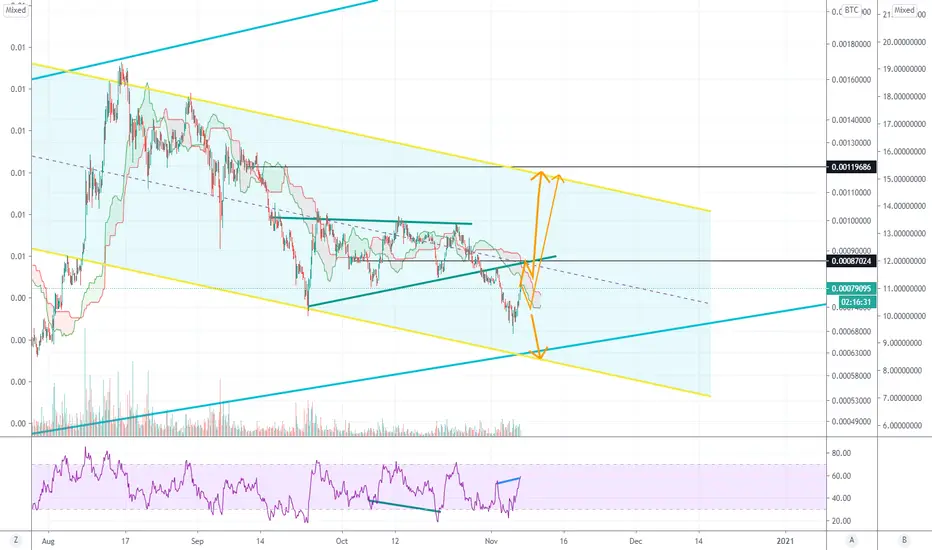
LINK looks good for a short period of time!So the 3rd wave was the top. And it seems we are in the C Wave of 4th wave. And even closer look, we are in the 4th wave of C. This means that it will go up to the green area (might extend a bit). But then the price will go down for the 5th wave.
After the 4th wave is over then we can start accumulating. For short term investment it can be bought but the position should be closed around green area.
Happy hunting !
LINKBTC trade ideas


Lank, still profitable !link
This cryptocurrency has a potential of another 16% profit. As it has given a 14% profit in the last 24 hours.
By examining the RSI, CCI and MACD indicators and considering the average daily trading volume as well as the Bollinger Bands indicator in the daily time frame, it can be concluded that there is still room for profit and should fluctuate.
Lank, still profitable.

LINKBTC which path?Which path will it follow, the double bottom or the inverted head and shoulders? I prefer the latter but price reached the ichimoku resistance and bearish divergence will form on the slightest pullback pushing prices down. All paths are good, unless it nukes for some unforeseen reason.
Link usd will follow a similar paths.
Chainlink key support has heldExpect new highs sooner and faster then you think! People forget that Chainlink has not once experienced a Crypto bull market, I am so excited.


LINKBTC Touching bottom of channelAbout time to flip some of your BTC over to LINK. This is for education purpose only not a financial advice.

relax and enjoy the ridebuy the dips and don't worry about the daily movements
project is fundamentally sound
let's see how this plays out
RIP KING 5.28.2016
Never forget

$LINK, Falling below ~78k support level...$LINK
Falling below ~78k support level.
As BTC keeps pushing up & & ETH drags Alts spotlight
I would expect further downside (S/R flip may happen so look for that entry if you are not already in)
~62k sats as next support level if continuation happens.
#LINK


Link looking bearish on both usdt and btc pairLink start to look bearish now
As you can see in btc pair it forming symmetrical traingle and start to break it
In usdt pair it test the trendline support for 4th time which make it weaker
And we can look for sell position if it broken or at retest it
Agree or not show your opinion in comment and support by like and follow

LINKBTC AnalysisSince there are 3 SELL signals present, I'm BEARISH.
So, I don't think this is a good time to buy yet.
If you want to buy again, we have 3 different options.
1- You can wait for EngineeringRobo's BUY signals to be present,
2- You can wait for candles to open-close above resistance level (0.00087) for 1D to buy,
3- You can buy when candles touching the support line (0.00045)
After you buy, please watch out for EngineeringRobo's sell signals and consider selling it.

LINKBTC Not in good shapeDropped out of the triangle unfortunately with a failed retest. Might go all the way to the bottom of the channel.
Previous idea discussed the triangle.

LINKBTC - Up or Down?I think we will see some of downward movement but what will occur after that?
We will analyze the steps..

CHAINLINK PRICE ANALYSISThe LINK market cap currently stands at US$4.22 billion, based on a 387 million circulating token supply, with US$770 million in trade volume over the past 24 hours. The spot price has continued to hit new all-times throughout 2020. Among the current top 20 coins by market cap, LINK was the best performer in the USD markets during 2019.
Technicals for the LINK/BTC and LINK/ETH pairs suggest a bullish outlook with a continued multi-year bull trend. f prices move higher throughout 2020 and 2021, LINK tokens held by Smart Contract Limited may again be sold at a higher rate, as was the case in July through August 2019. Additionally, as ETH enables staking later this year, the LINK/ETH pair may enter a short-term bear market fueled by ETH speculators.
Previous Close 0.001
Open 0.001
Day's Range 0.001 - 0.001
52 Week Range 0.0002 - 0.0017
Start Date 2017-09-20

LINK/BTC long I'm not super into this trade, it being the eve of US election, so definately manage your risk... but gonna take a link long here vs btc.
Taking the low from October 7 as a basis for a stop, its a 6R trade.
But if the most recent low is taken, it is over a 10R trade.
And if it does get to target area, indicated by green resistance line, around 95000 sats, I will manage it with a moving stop as opposed to a limit sell, as that will be the 5th touch on the resistance, and it very well could break through to the upside and reach its previous all time high.
Entry: 0.00081122
Stop: 0.00080000 or 0.00079000
Targets: 0.000850000, 0.00095000, w/ trailing stop
Watch out for election wicks.
Travis
In God's Will
JMJ

Bitcoin Bull Market Has Only Started *** Here Is PROOF ***MartyBoots here. I have been trading for 13-14 years and I am here to share my ideas with you to help the Crypto space.
Bitcoin Bull Market is here right now
Bitcoin Is Very Bullish right now and will move a lot higher
If you want help trading Bitcoin or any other ALT coins hit me up , We will improve your trading
There is life changing opportunities soon
ALT SEASON IS COMING be prepared


IS LINK PREPARING FOR A NEW ALL-TIME-HIGH?Over the past two years LINK has been bouncing off the daily MA200 on the logarithmic chart, resulting in a rally over 7000%.
In the coming month the chances are that it will hit the MA200 again. Looking at the past, getting close to the MA200 will result in a bounce with >100% growth each time, resulting in new all-time-highs.
Will LINK bounce and ascend to new all time highs or will its crazy run-up finally come to an end?
...................................................................................................................................................................
If you like this analysis, please like, subscribe and comment.
...................................................................................................................................................................


LINK THE CHART YOU DONT WANT TO SEE Sorry if you are a fellow link marine, Im looking at the end of an symmetrical triangle. In this position it is bearish as it is supposed to break in down trend continuation. I'll probably short the break down.
BTC in a run at the moment even if it took a pullback recently. Alts ALWAYS BLEED during BTC runs at it sucks all the liquidity from the crypto market. Be careful alts can drop -90% when BTC is on a big run. Especially link which was on a long bull run.
I love link tho, its just not right technically. Still could be wrong as it is a special alt and its runs are pretty surprising tbh. But ratios favor shorts if we break down from this triangle!
GL HF!
