long link long link when rsi touches the support , or/and when the price retraces to the cluster of supports (200ma + trendline)
LINKBTC trade ideas

🔥 LINK/BTC Bullish Break Out Still Intact: Massive Move SoonAfter a very long and gruesome 1.5 years of losing value against BTC, LINK has finally broken out of the bearish trend.
Even after yesterday's sell-off, LINK appears exceptionally strong and the break out is still intact. Assuming that BTC will either consolidate or go bullish in the near future, I'm anticipating further appreciation of LINK/BTC. Be aware that we might re-test the dotted resistance line and turn it into support.
Targets placed at a recent top and the all-time high.
Happy trading!

Chainlink Breakout against BTCChainlink bullish indicator emerging.
Watch out Chainlink against BTC, ETH and USD.
This may be a sign for a breakout.
No financial advice.

Great spot to enter if we get this on LINKGreat spot to enter if we get this retest on LINK
It just looks glorious in general

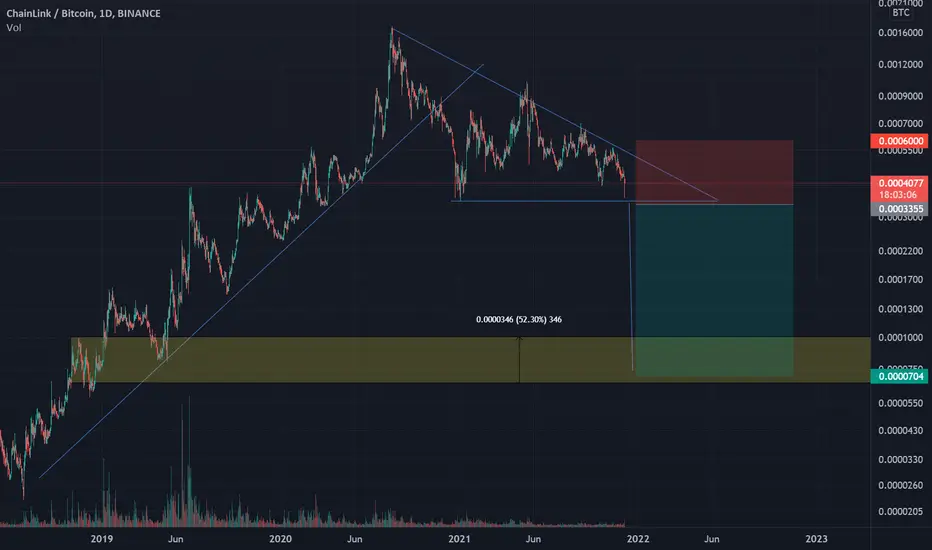
LINKBTC descending triangleDear Friends LINKBTC chart is forming a descending trinalge which is a bearish pattern. Use only maximum 2% of your total portfolio value for this trade.
sell when daily candle closes below 0.0003500
stop loss at 0.0006000
profit target 0.0000700
risk & reward ratio 1:1
descending triangle has 72.93% Success rate
Tough not to get excited about LINK hereRecovered a key support level as well as smashing through a key resistance level on the weekly.
Looks very strong.

LINK/BTC. ChainLink Strong Bullish Signal 60% and 3x Targets.This is a trade I've been anticipating for a long time. ChainLink is finally showing signs of reversal of the bearish trend that lasted for a year and a half since August 2020. ChainLink has been consistently outperforming Bitcoin. I expect ChainLink to climb 60% by February 2021 and to triple versus Bitcoin by July 2021. If you consider that Bitcoin itself will double in price by July 2021, then ChainLink would 6x vs USD by that time.
Be mentally prepared to lose about 25 to 30% of your capital on this trade. Set a generous stop loss and do not risk an amount that you cannot afford to lose 30% of. But whatever you do, do not ignore setting the stop loss. Watch the video for more details and good luck.

ChainLink Trade Update Weekly and 12-HourI talk about two trades in this video, one on the weekly timescale and another on the 12-hour timescale.
Summary:
Weekly trade is still in play.
12-hour trade exited as stop-loss hit. Waiting for a point of re-entry.

LINKLINKBTC cleary broke the resistance and we might see a back test , but pretty sure it will go higher than this

LINK BTC 2022Looking at a possible repeat from previous price action.
Going off Fib lines it was seen that link retested the high before retracing to the 0.618 golden pocket before reaching for the 1.272 / 1.414
Thereafter retracing to the prior 0.886 and then reaching for the 1.618 followed by a retrace to the 1.272 just mentioned.
ultimate target just shy of the 2.0 fib extension. Looking to exit between 1.618 and 1.786 for this market

LinkBTC ready to go!- bottom of the channel
- strong support area
- MACD divergence on D and W timeframes

Breakout or Breakdown?LINK is currently within a Falling Wedge (bullish) inside a massive Descending Triangle (bearish)--and both are converging on the same general point. Sellers are exhausted and supportive momentum appears to be building, but the Descending Triangle presents a lot of overhead resistance. My view is that the resistance will continue to suppress the price for 1-2 weeks before we see enough support to breakout. I'm considering averaging into a position here.
--------------------------------------------------
These are my personal views and not financial advice. Please do your own research before investing.
I'd love to hear your thoughts, ideas and feedback. Feel free to comment and I'll try and get back to you quickly.
If you appreciated this analysis, consider Liking or Following. Thanks!

ChainLINK Presents us with a New Entry PointThe trade is in the chart. A long position with potential loss of 4% and potential gain of 12%. RSI gives us a local divergence and we have three bullish reversal candles which make an ascending triangle on lower time scales. This trade should be done in the hourly chart actually. Anyway, manage your risk. Set your stop loss so that you lose at most 4% of your allocated capital on this trade. Once we go up about $1.2 (we gain as much as we are risking), then raise your stop loss to the entry point so that at the worst case, you break even and you keep your capital without loss. Good luck.
You can view this chart here .
Also look at my LINK/USDT hourly chart , but on this chart, the trade doesn't look very lucrative :(

LINKBTC will see new ATH in 2022Or I eat my own DICK.
Chainlink is fundamentally the MOST important project in this space. Why? Because ANY application of blockchain beyond basic tokenization and (((NFT's))) need Oracles to provide definitive truth. The oracle space naturally leads to a Monopoly and Chainlink both has the first mover advantage, institutional backing and network effects already nearly unchallengeable. I could go on and on but you get the point.
Chainlink is fundamentally undervalued.
Chainlink is necessary for the future of humanity. It is a TRUTH machine, untamperable, unshutdownable, unstoppable.

LINKBTC/BULLISH IDEAwaiting for breakout the trend line and ma20.
Price stabilization above 0.00053.

LINK Making Gains On BTC!!?Chainlink on a weekly timeframe has broken out against BTC and we are looking bullish! Ontop of that good news we got some more amazing news from Sergey Nazarov, Chainlink staking is going to be released this year! Absolutely huge news and a big win for the LINK community, the people have been waiting years for this to happen, once the news comes out where staking is live i expect link to see some massive volume and likely a lot of FOMO! Our first test for Chainlink on the weekly is aprx 0.0005 BTC. Looking at the RSI we have broken nicely above the yellow SMA and we are heading to the upside where we will be approaching the very important midline, we gotta break up and above here and hold it for us to regain an uptrend, being below this level keeps us in a confirmed downtrend. The MACD looks good we seem to be coming out of a double bearish cycle with our histogram now right on the midline, the goal here for weekly close tonight is to print a strong green bar on the histogram and then afterwards continuing to print green bars that are increasing everytime, its also looking like we are going to see a bullish cross which is always a good thing and due to our previous 2 bearish cycles this next bullish one could be huge! Now the Wavetrend is sending off some bullish signals aswell, we have bottomed out and we are making a very healthy rounded curve for our reversal, keep in mind just on the daily chart this is a slow moving indicator that usually doesnt make sharp moves, on the weekly its even more powerful and slow moving, we could be in for a big bullish wave coming up soon, especially because we have seen quite the downside over the past months! Not financial advice just my opinion!

Link BTCLink BTC
Link is showing it wants to regain some of its strength against BTC. This close to weekly close and yearly open
strong moves to either direction are possible.
1D chart approaching nice risk adjusted setup for a break out play or a continuation if your already in the assit.
Testing 1 year long trendline
Testing 50rsi
MacD bullish crossover
MacD bullish div
Will be looking to play this in a binary fashion. It breaks out or it breaks down.
Will also be watching for a fake break out and then a strong breakdown.
If I catch a breakout I will add with more size on a break out and retest.
Trade Frosty.

LINK/BTC Head & ShouldersPotential Head & Shoulders pattern forming on LINK/BTC pair after we bounced off long term support twice and formed a double bottom. If the H&S pattern plays out, we could break the trend line and reverse the trend. Daily Stoch RSI is crossing up, which indicates bullish momentum. Fundamentally one of the strongest projects, hopefully the price will follow. Good luck!

LINK/BTC HAS BOTTOMED! BUY NOW?I personally think LINK/BTC has bottomed and I’ll be adding some here for my spot holdings.
(SPOT trade🚨)
TP1 = $0.00104 🎯
TP2 = $0.001692 🎯
TP3 = $0.00303 🎯
Trade safe ~ BYA


Link/BTC falling wedge breakout?BINANCE:LINKBTC bounced off a key support level on the 1D (the green highlighted box). Link has been in a falling wedge for a LONG time, we may finally see a breakout now that we have bounced off of a key support level.
@cryptobullet1 tweeted about this wedge, and i agree, i think this bounce may take link up.

LINK/BTC Ready to 300% Gain upward from here..?#LINK/BTC TA Update:-
$LINK currently trading at $4435 Satoshi
And This week strong bounced back from 3800 Satoshi support level.
Entry:- 3800-4400 Satoshi
Targets:- 5300/9100/15800 Satoshi
Stop Loss:- 3500 Satoshi
First LINK need to break out 5300 Satoshi level.
Above this Level #LINK will be sky rocket.
Support:- 3900 Satoshi
Resistance:- 5300/9100/15800 Satoshi

