Long trade www.tradingview.com
🟢 Buyside Trade
Pair: LINKUSD
Date: Saturday, 5th July 2025
Time: 8:00 PM
Session: Tokyo Session PM
Time Frame: 4Hr TF Entry
🔢 Trade Metrics
Entry Price: 13.161
Take Profit (TP): 25.814 (+96.14%)
Stop Loss (SL): 12.984 (−1.34%)
Risk-Reward Ratio: 70.32: 1
📈 Chart Analysis
St

Will you have a change to enter $4 per $LINK This will be truth in the next few months then we will have a very very good entry at $4 per BIST:LINK

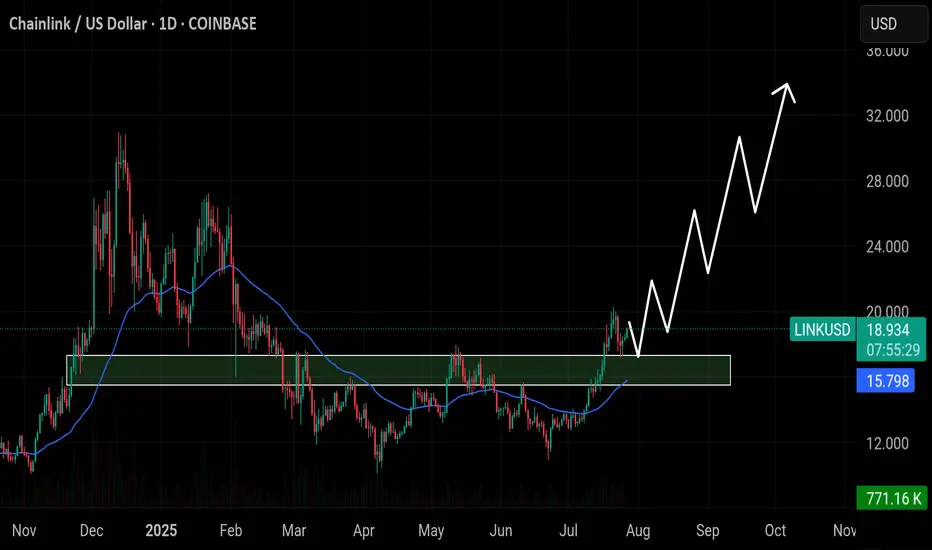
Chainlink ($LINK) has flipped the $15.80 zone into strong supporChainlink ( CRYPTOCAP:LINK ) has flipped the $15.80 zone into strong support — as long as it holds, bullish momentum could push toward $24, $28, and possibly $32 in the coming weeks.
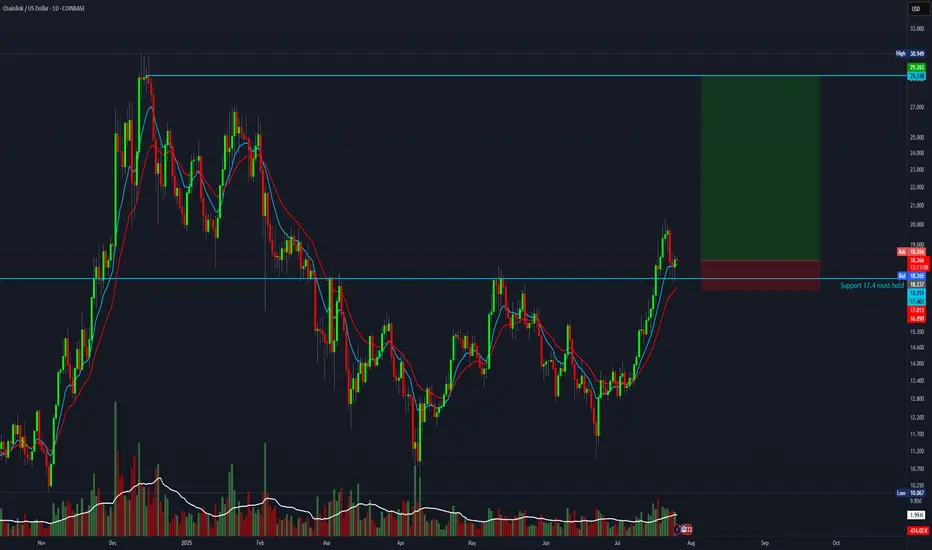
8 R setup for ChainlinkBTC is about to flip upwards. This is the chance to take a high-reward trade with an 8:1 risk-to-reward ratio.
Entry: 18.23
Stop-loss: 16.8
Target: 29
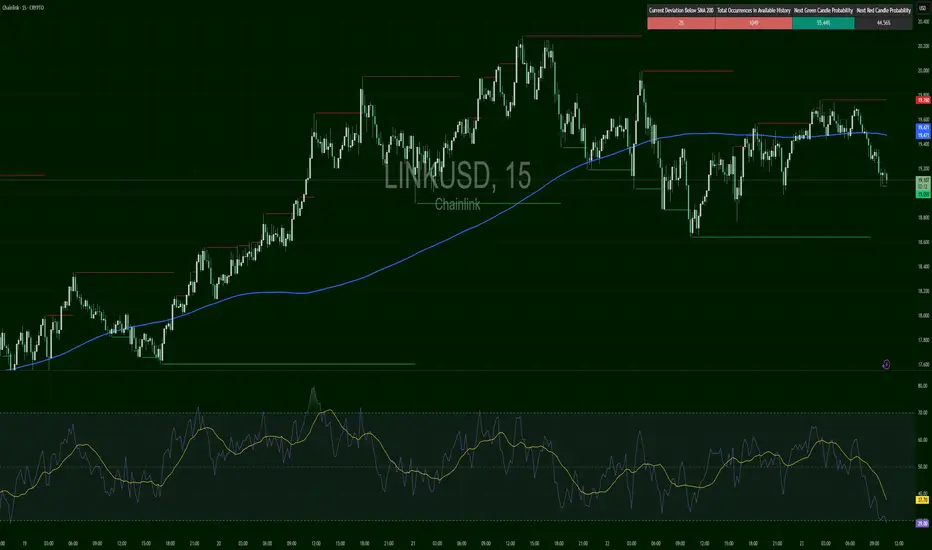
LINKUSD – Finally Flipped the TrendLINK surged after reclaiming $17.78 and breaking through the 200 SMA for the first time in days. RSI hit >63 and now rolling. If $18.05 holds as support, bulls may push toward $18.22 and higher. Weakness below $17.78 would fade the setup.

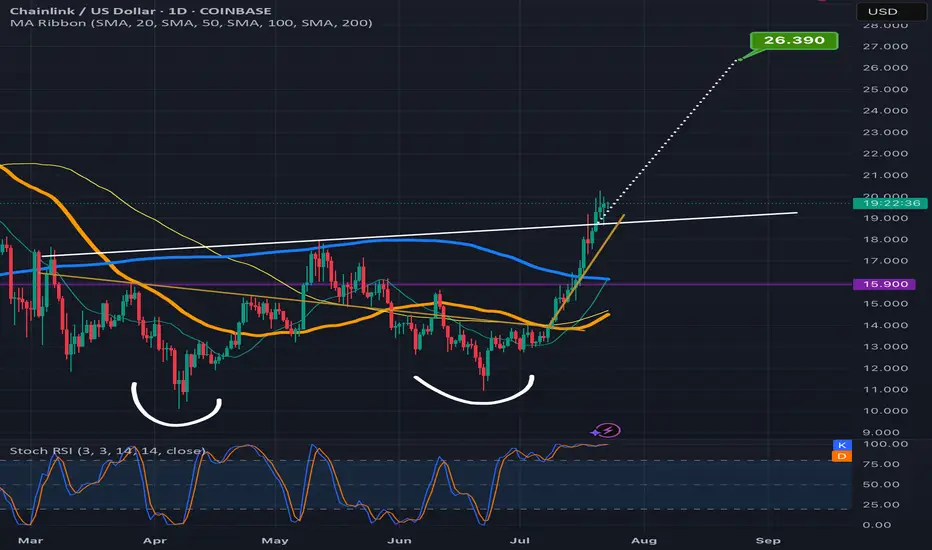
Chainlink climbing the measured move line staircaseLooks like Chanlink is ready to confirm the double bottom breakout here as the past few candles have already started to climb up the measured move line like a staircase.Always possible for a dip back below the neckline at this point but probability slightly favors the readout being validated instead
The Oracle Singularity: CHAINLINK is Inevitable or Cooked?How many marines are tracking this ascending channel?
How many are watching this Fibonacci time sequence unfold?
How many are following the mirrored bar fractal that might just be a crystal ball into the future?
Today you get all three in one TA. The value here is absurdly high . Even though I offl

$LINK – VAH RejectionKeeping an eye on this one. Watching the rejection off VAH — I’d consider laddering in around the POC and VAL. We've also got confluence with an anchored VWAP, GP, and a monthly order block in play.

LINKUSD – Structure Snapped, Momentum GoneLINK broke trend structure clearly. After peaking around $19.76, it rolled over, crossing below the 200 SMA. RSI hit 30.54 — deeply oversold. Price is now compressing near $19.05. A rejection from $19.20–$19.30 would confirm bearish continuation. However, if RSI bounces above 40+ and price flips $19
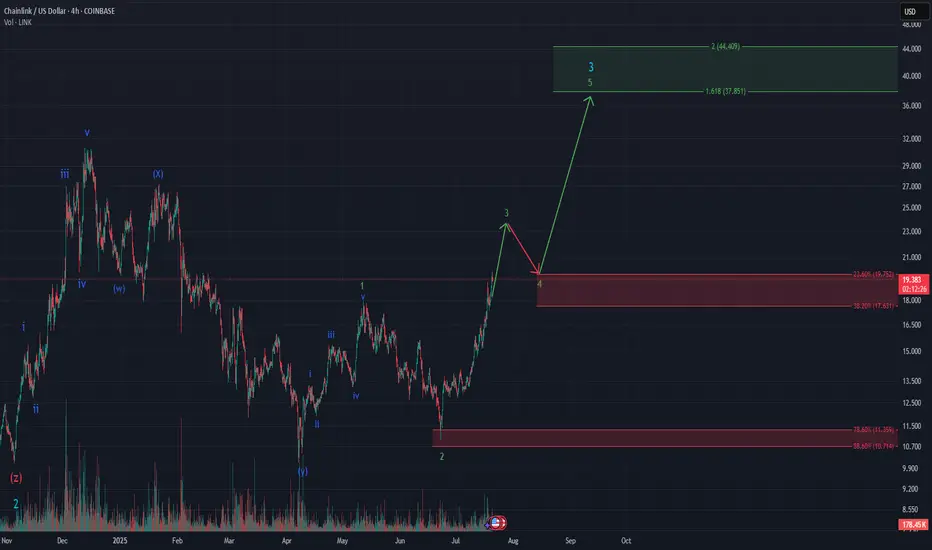
Chainlink – Deep Wave 2 Retracement / Powerful Wave 3?The current 4h chart on CRYPTOCAP:LINK is a textbook Elliott Wave setup – clean structure, impulsive momentum, and retracements that align beautifully with Fibonacci levels.
Wave 2 of the ongoing impulse retraced deeply – almost 88.6%, technically valid but aggressive. According to Neely’s Rule o
See all ideas
Summarizing what the indicators are suggesting.
Oscillators
Neutral
SellBuy
Strong sellStrong buy
Strong sellSellNeutralBuyStrong buy
Oscillators
Neutral
SellBuy
Strong sellStrong buy
Strong sellSellNeutralBuyStrong buy
Summary
Neutral
SellBuy
Strong sellStrong buy
Strong sellSellNeutralBuyStrong buy
Summary
Neutral
SellBuy
Strong sellStrong buy
Strong sellSellNeutralBuyStrong buy
Summary
Neutral
SellBuy
Strong sellStrong buy
Strong sellSellNeutralBuyStrong buy
Moving Averages
Neutral
SellBuy
Strong sellStrong buy
Strong sellSellNeutralBuyStrong buy
Moving Averages
Neutral
SellBuy
Strong sellStrong buy
Strong sellSellNeutralBuyStrong buy
Displays a symbol's price movements over previous years to identify recurring trends.
Curated watchlists where LINKUSD.P is featured.

DeFi Tokens: Finance 2.0
24 No. of Symbols

ETH-based crypto: Find your utility
38 No. of Symbols

Gen 2: Crypto is here to stay - and it's brought some friends…
19 No. of Symbols

Interoperability Crypto: Communication station
14 No. of Symbols

Polkadot Ecosystem: Spot the best
19 No. of Symbols

Smart contracts: Make the smart decision
36 No. of Symbols

Top altcoins: Choose your alternatives carefully
28 No. of Symbols
See all sparks