Long trade www.tradingview.com
🟢 Buyside Trade
Pair: LINKUSD
Date: Saturday, 5th July 2025
Time: 8:00 PM
Session: Tokyo Session PM
Time Frame: 4Hr TF Entry
🔢 Trade Metrics
Entry Price: 13.161
Take Profit (TP): 25.814 (+96.14%)
Stop Loss (SL): 12.984 (−1.34%)
Risk-Reward Ratio: 70.32: 1
📈 Chart Analysis
Structure: Price broke the previous consolidation zone and retested key support levels near the 13.16 area before launching upward.
Indicators:
200 WMA (Yellow) & 50 EMA (Blue) both support continuation.
Break of market structure confirmed prior resistance as new support.
LINKUSD.P trade ideas

Will you have a change to enter $4 per $LINK This will be truth in the next few months then we will have a very very good entry at $4 per BIST:LINK

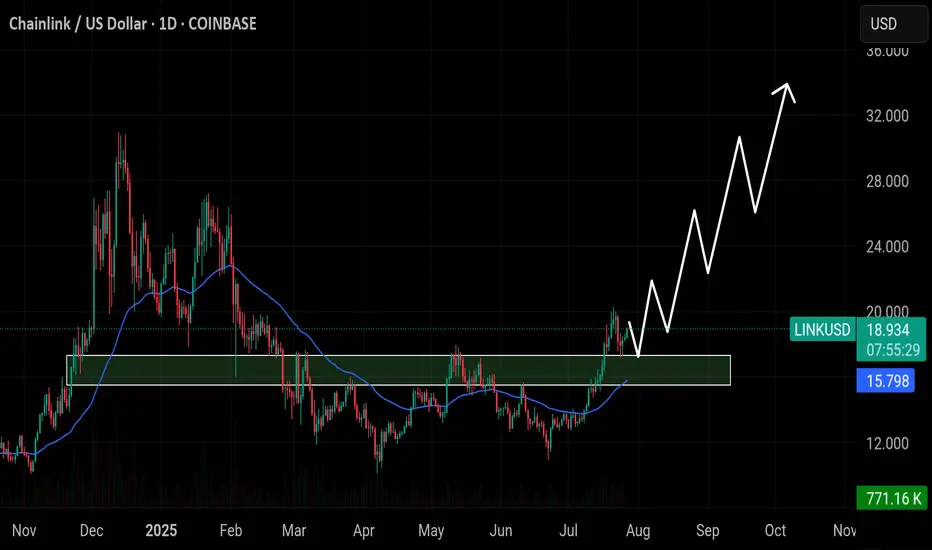
Chainlink ($LINK) has flipped the $15.80 zone into strong supporChainlink ( CRYPTOCAP:LINK ) has flipped the $15.80 zone into strong support — as long as it holds, bullish momentum could push toward $24, $28, and possibly $32 in the coming weeks.
LINKUSD – Finally Flipped the TrendLINK surged after reclaiming $17.78 and breaking through the 200 SMA for the first time in days. RSI hit >63 and now rolling. If $18.05 holds as support, bulls may push toward $18.22 and higher. Weakness below $17.78 would fade the setup.

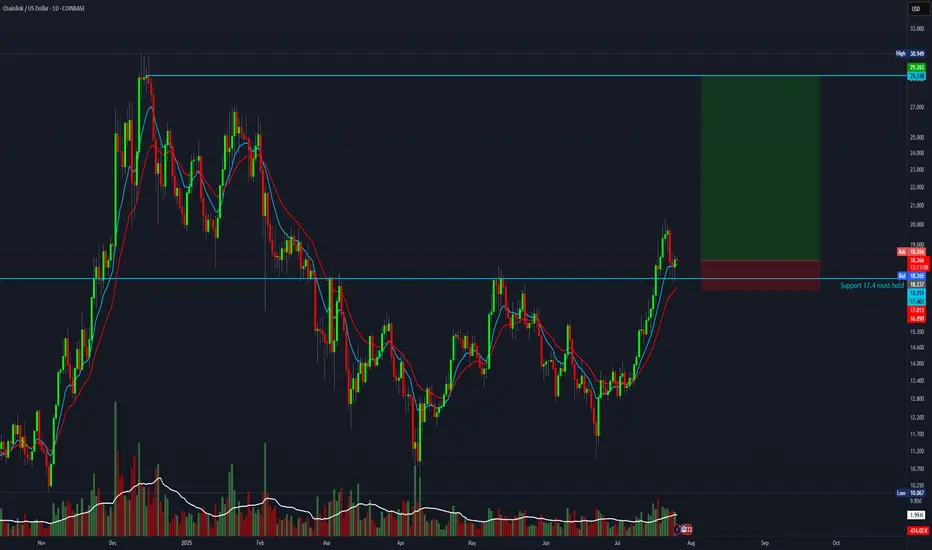
8 R setup for ChainlinkBTC is about to flip upwards. This is the chance to take a high-reward trade with an 8:1 risk-to-reward ratio.
Entry: 18.23
Stop-loss: 16.8
Target: 29
$LINK – VAH RejectionKeeping an eye on this one. Watching the rejection off VAH — I’d consider laddering in around the POC and VAL. We've also got confluence with an anchored VWAP, GP, and a monthly order block in play.

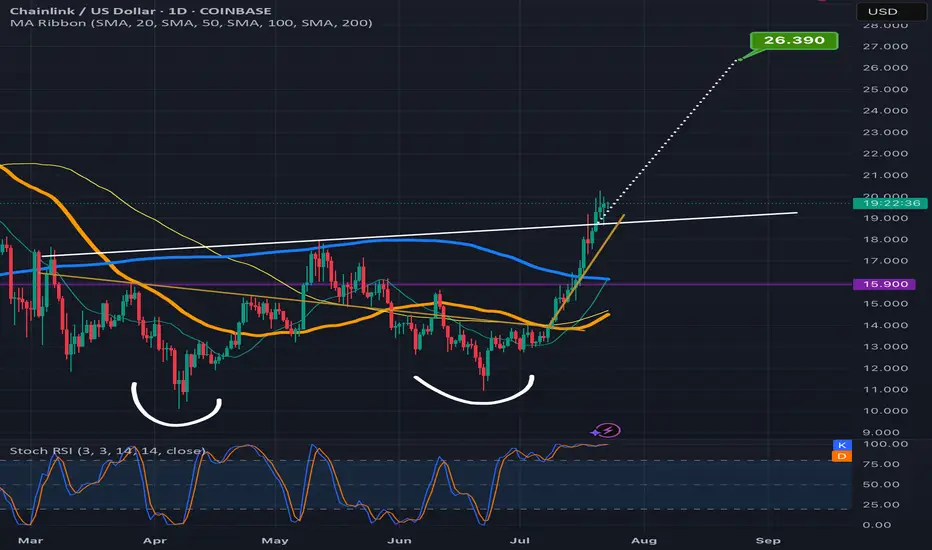
Chainlink climbing the measured move line staircaseLooks like Chanlink is ready to confirm the double bottom breakout here as the past few candles have already started to climb up the measured move line like a staircase.Always possible for a dip back below the neckline at this point but probability slightly favors the readout being validated instead for now. *not financial advice*
LINKUSD – Structure Snapped, Momentum GoneLINK broke trend structure clearly. After peaking around $19.76, it rolled over, crossing below the 200 SMA. RSI hit 30.54 — deeply oversold. Price is now compressing near $19.05. A rejection from $19.20–$19.30 would confirm bearish continuation. However, if RSI bounces above 40+ and price flips $19.35, it could fake out bears.
The Oracle Singularity: CHAINLINK is Inevitable or Cooked?How many marines are tracking this ascending channel?
How many are watching this Fibonacci time sequence unfold?
How many are following the mirrored bar fractal that might just be a crystal ball into the future?
Today you get all three in one TA. The value here is absurdly high . Even though I offloaded most of my LINK a while back it continues to act like a compass for future macro crypto moves.
You really need to look at the TA to understand what I mean
Now look at this
The deviation in the LINK bar pattern seems to be reaching its conclusion around mid October 2025 and if you’ve seen my last Bitcoin TA you know I’ve been targeting that same mid October 2025 window for a potential BTC top. That’s a serious timeline confluence.
But here's the twist
The main chart projects a $200 LINK by April 2026. If that plays out then I have to entertain the possibility that this cycle extends past my original thesis and that my Bitcoin top call may come in earlier than Chainlink's final move.
If Bitcoin does in fact top in mid October then LINK likely won’t have the legs to hit those upper targets.
Back in 2021 when LINK was trading at a similar price it only took 119 days to reach $50 that would put us at November 2025 for a repeat. Something doesn’t quite add up
Now check the main chart again
This Fibonacci time sequence is liquid gold. It’s nailed major tops and bottoms for years (see the blue circles). Every major move has hit right on time except for the 3.618 in October 2022 which was a rare miss.
But here's the kicker
There’s no Fib time event between October and December 2025. The next ones are in August 2025 and then April 2026
So is LINK trying to tell us the cycle extends into 2026?
Maybe. All I’ll say is this
If the cycle doesn’t extend into 2026 then LINK IS COOKED

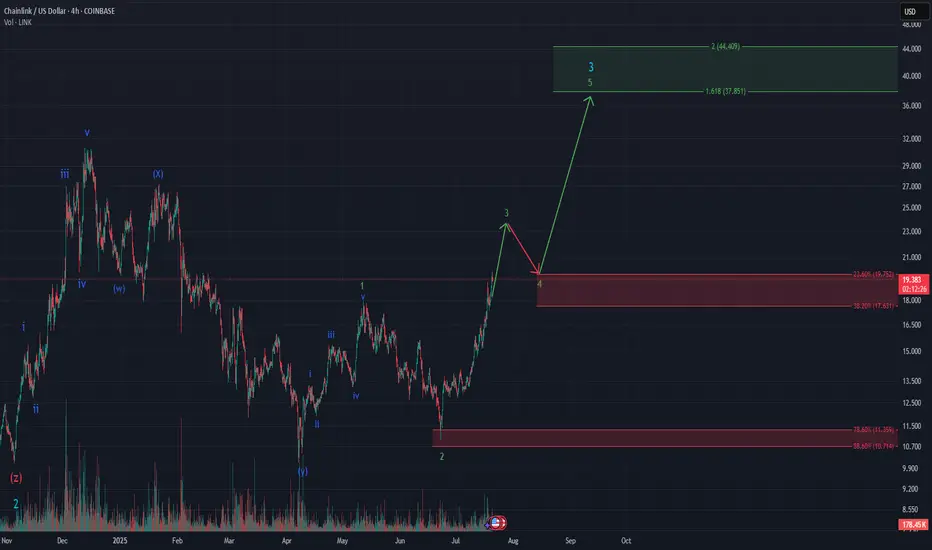
Chainlink – Deep Wave 2 Retracement / Powerful Wave 3?The current 4h chart on CRYPTOCAP:LINK is a textbook Elliott Wave setup – clean structure, impulsive momentum, and retracements that align beautifully with Fibonacci levels.
Wave 2 of the ongoing impulse retraced deeply – almost 88.6%, technically valid but aggressive. According to Neely’s Rule of Alternation, this increases the probability that wave 4 will be shorter and less complex.
I expect the next short-term target for wave 3 around the 23.6% retracement at $19.75, before we build wave 5 to complete a much larger green (3) – targeting $37.851 as the minimum projection.
Momentum is strong, volume is picking up – and this might just be the move that brings retail traders back to LINK.
🔹 Are you bullish on Chainlink?
🔹 How high do you think wave 3 can go?
👇 Drop your thoughts in the comments and follow for more detailed Elliott Wave crypto setups.
#Chainlink #LINK #ElliottWave #Fibonacci #CryptoAnalysis #Wave3 #TechnicalAnalysis #Altseason #ImpulseWave #LINKUSDT #TradingView
LINK - optimistic version.LINK may be finding itself in the beginning of a major proverbial wave III.
LINK Just Rejected Hard — Is the Rally Already Over?Chainlink exploded straight into multi-month resistance — and instantly got slapped down. First taps often reject, but if price flips this zone into support, it could open the door to $20+. One of the most important levels on the chart.

Chainlink Macro SurgeChianlink macro pattern triggered, fundamentally strong. Even though link is known for wild swings this is a spot hold to target $164.

LINK to $230 - $1,087 ALT EW Count Stablecoin Supercycle Part 6!Genius Stablecoin Act just got passed! LETS GO! STABLECOIN SUPERCYCLE!
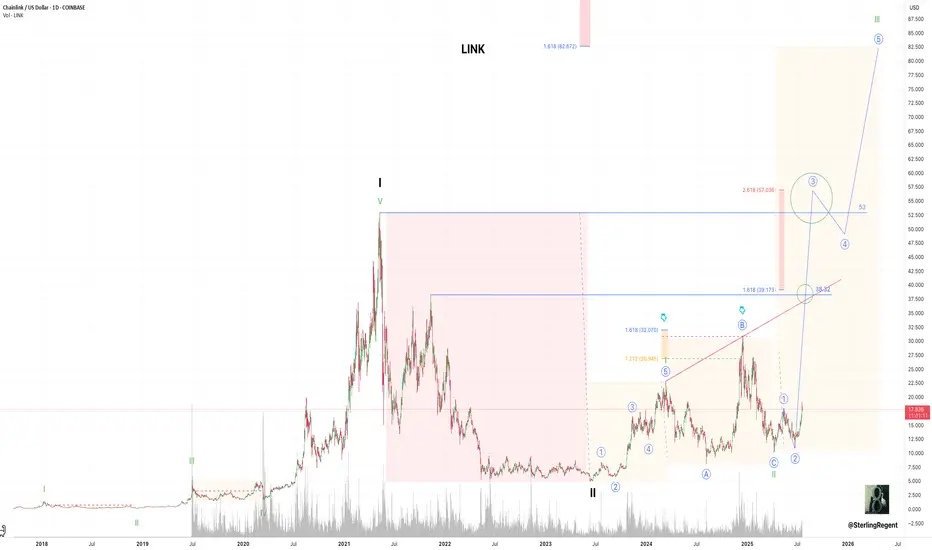
A few months ago I presented a Primary Elliott Wave Count that suggested Chainlink would top out between $60-$100. Here is the Alternative Elliott Wave Count that suggests that Chainlink will easily hit $230 this market cycle and possibly even 4 digits!
In this alternate wave count, Chainlink is trading in a series of nested 1-2, 1-2, 1-2, 1-2 structures, and the Wave 3 expansions that are about to occur aren't going to send Chainlink to the moon, they are going to send Chainlink to Pluto and beyond. Chainlink will easily hit the 1.618 fibbonaci retracement from the 2021 Bull Market Top to the 2023 Bear Market Bottom which results in a $230 Chainlink. The 2.272 fibbonaci retracement lands Chainlink at $1,087. LOL!
Is this a high probability trade setup? No. Nested 1-2 structures are prone to failing because if one single 1-2 setup fails, it becomes a domino effect where the next 1-2 wave structures are prone to failing. As stated before, I am still expecting the primary wave count to take place with Chainlink topping between $60-$100.
Why did I make this post? Because... everyone is still very underweight alt coins lmao. As stated in previous Ethereum posts, DISBELIEF RALLY happening before your very eyes.

LINKUSD - Possible Correction from Channel ResistanceStructure: Ascending Channel
Indicators: RSI Overbought, Bearish Divergence Forming
📌 Confirmation:
Look for:
A strong bearish candle or
RSI breaking below 60
Volume divergence
Bias: Short-term bearish correction, bullish structure intact as long as price holds the channel.

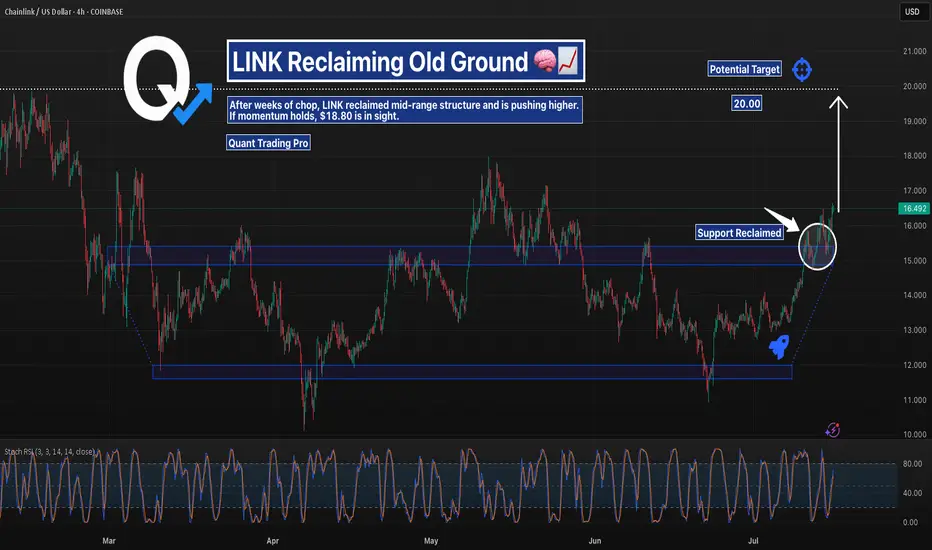
LINKUSD – Mid-Range Reclaim | Push Toward $18-20?Chainlink has reclaimed the mid-range supply zone between $14.50–$15.50 and is now pushing higher.
The structure looks clean with a potential target near $18.80 if bulls maintain strength.
Key support now sits around the breakout zone. Watching for continuation or a failed retest.
#LINKUSD #Chainlink #RangeBreakout #SupportResistance #QuantTradingPro #TradingView
LINKUSD – Relentless Rally HoldingLINK rallied off $14.70, then chopped into $16.50 resistance. After a brief rejection, bulls took control again and printed a new local high. Trend is aggressive and persistent, with every dip bought. Support is $16.20–$16.25 — bulls must hold that zone to stay in control.

LINK‑USDT | 4H / 1H Confluence Play – “Gap Rebalance or Flush?” LINK‑USDT | 4H / 1H Confluence Play – “Gap Rebalance or Flush?”
LINK is drifting up into a Potential Reversal Zone (PRZ) at 16.48 – 16.65 USDT, created by:
4H + 1H Fair‑Value Gap (bearish displacement candle of 22 May)
TPO single‑print strip on both Binance LINKUSDT perp and spot – un‑auctioned prices from 16.48 to 16.60
0.764 / 0.786 fib retrace of the current downswing
Minor composite LVN just above at 16.70‑16.75 – ideal liquidity sweep level
Historically, 70 % of crypto FVGs of this height (≤ 0.8 %) get at least a midpoint tag within 5 sessions. The mean reversal clock is 10‑15 minutes once price first pokes the gap; if we churn inside for > 3× M5 bars without rejection, odds flip to acceptance.
What I’m watching inside the zone
M5 structure break – lower‑high or close below last M5 swing low.
OI stall or roll‑over – no new longs piling in.
CVD flip ≤ 0 – aggressive sellers absorb bids.
When all three align, I’ll size up; otherwise this is just a magnet, not a wall.
Blind‑limit ladder (probe only)
16.535 (gap midpoint) – 25 % size
16.590 (single‑print top) – 35 %
16.665 (liquidity sweep under LVN) – 40 %
Unified stop: 16.78 (above LVN cluster, 0.9 % risk)
Trade thesis: This zone is “unfinished business.” If order‑flow confirms rejection, expect a swift mean reversion; if price converts single prints into value (multiple prints + rising OI), abandon the short bias and look for acceptance > 16.80.

LINK has FINALLY Broken out of a 207D DowntrendReclaimed the .236 Fib 🔥
Volume to confirm ✅
Bullish crossover on the 20 / 50MA
It’s about time!!!
CRYPTOCAP:LINK Marines Unite 🪖

Chainlink Just Broke Out — Is $30 The Next Stop?After nearly 250 days of compression inside a falling wedge, Chainlink has officially broken out. The chart shows a textbook breakout with clean structure, higher lows, and a confirmed break of structure (BOS). A retest zone between $12.8–$14.0 could offer a “buy the dip” opportunity before any continuation.
With momentum shifting and sentiment improving, bulls have eyes on the $30 target — a prior high and wedge-measured move. This is a breakout you don’t want to ignore.

LINK: Critical Chainlink Update!! | Stablecoin Supercycle Part 4🚨 New Video Just Dropped! 🚨
Today, I cover the latest Genius Stablecoin Act update, Shanghai’s surprising interest in stablecoins, and go deep into Chainlink’s technical setup — including Wyckoff, Elliott Wave, short-term outlook, and Fibonacci time analysis.
Video Timestamps:
0:00 Genius Stablecoin Act Update
1:25 Shanghai considers stablecoins!
2:53 Chainlink Risk/Regression Analysis
5:55 Chainlink Wyckoff Accumulation Analysis
8:12 Chainlink Primary Wave Count Elliott Wave Analysis
10:14 Chainlink Short Term Analysis
11:27 Chainlink Fibbonaci Time Analysis

LINKUSD – Caught in a Tug-of-WarLINK broke out impulsively above $15.60 yesterday but failed to sustain and pulled back into $15.00. Price is ranging now with lower highs and flat support. A clean flip of $15.45 is required for bulls to regain control. Below $15.10 risks continuation lower.

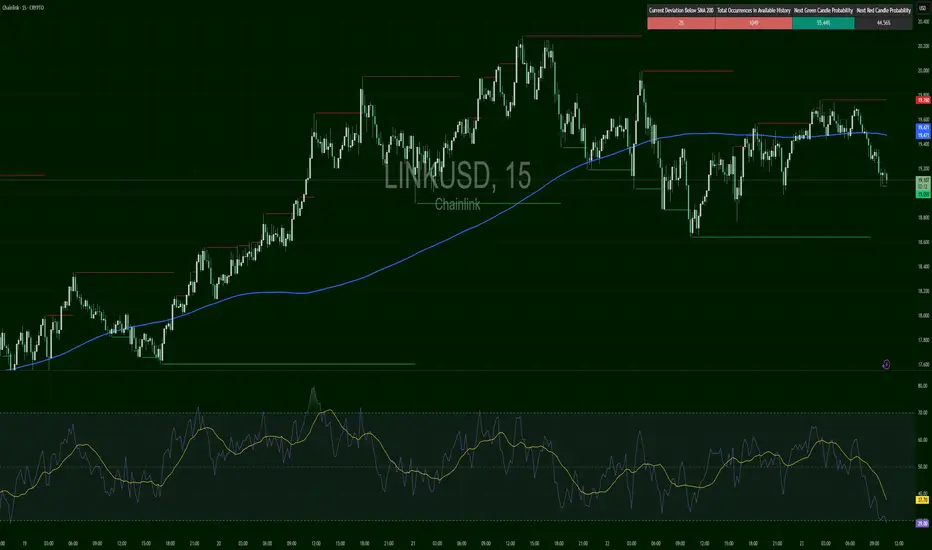
Crucial hour for $LINKAfter a massive leg up, longer time frame charts show there’s still some left in the tank but the hourly chart beg to differs.
First time today that we have the MACD touching and on the brink of a crossover to the down-side along with then stoch RSI on longer time frames showing a downtrend now.
The rising volume is encouraging and we will need a very strong hourly push here shortly if we want to keep the party going.
