LINK/USDTThe Bottom Area Of Second Wave 8.9-10.5$
Thırd Wave Target Wıll Be 121$ As The Lowest.
The Approxımate Date For The End Of Second Wave Is Between 27th Of July- 28th Of August
LINKUSD.P trade ideas

Long your longsPitchfork still playing out
Can we just get some decent price action already, volume suggests this may be within next 1-4 weeks,
Good luck

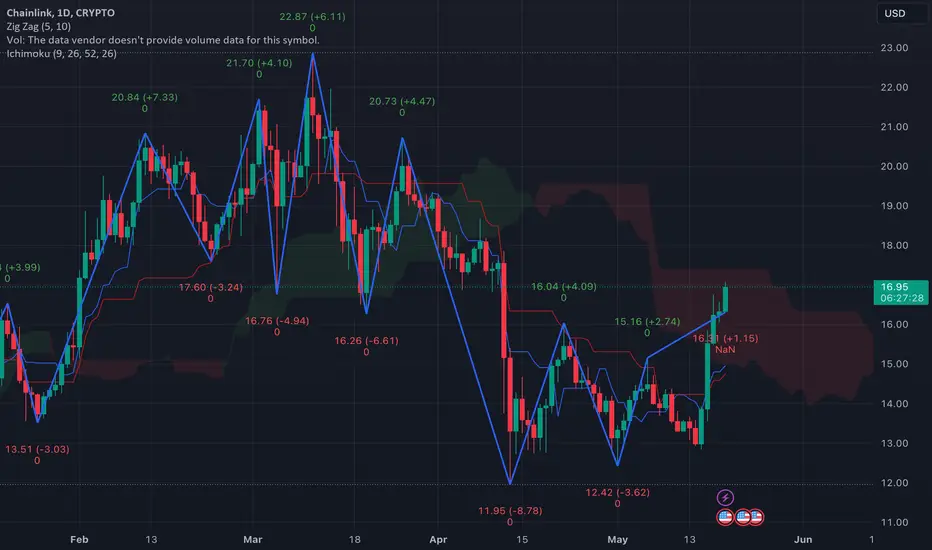
Are the lows in ? This idea holding true for now,
We have a $12 low on the cycle low.
We could range here for another 1-5 weeks then move up.

Long trade Entry 1min TF
Friday 14th June 24
19.45pm
Tokyo Session
Buyside
Entry 14.742
Profit level 16.241 (10.17%)
Stop level 14.546 (1.33%)
RR 7.65

Chainstink About To Smell Good?Chart long term looks very good with the view that $5~ was our stone bottom and we are early days of what appears to be a new bull trend - structure off the bottom is textbook impulsive and is giving me more confidence in this forecast - Accumulating here seems to be a decent play for a long swing to capture a potential upcoming alt season.

Chainlink investment technicalsThe cycle low consolidation located atop the golden ratio of the primary cycle indicates a new cycle, after a similar pattern to last (2018-2019)
The new cycle is on track with last (2019-2020) with a potential for breakout indicated by market structure..
Bitcoin is coming to 60% of the market, meanwhile massive altcoins stay at relatively lower market capitalization relative to bitcoin. (keep in mind bitcoin is at ATH now and above important moving averages)

Link/Sol- time to rotate ?This chart has looked awful for a very long time,
I’m sure everything against sol looks awful right now,
If you are considering where the gains may be, possibly rotating your sol to LINK could be a good move
Good luck out there

Link Usd Long TradeA historical movement from Dec2019/Feb2020 is being repeated in real time.
This is a 3 to 4 weeks trade.
Risk to reward is 1:9.
Be patient.
This is a waiting game not a trading game.

ChainlinkLink is heading to 28-32
Marketcap would be close to 20 billion
Weekly rsi is currently at 60 and should between 80-90 if we go up to 28-32.
Looking forward to when Link consolidates above 28. Still early.

Don't Bet on #QUANT. CHAINLINK is the clear leaderThere will be sympathy pumps by #QNT
But I suggest betting on the best in breed with the visionary/genius founder (SN)
#LINK should outperform QNT by 2:1
as the inverse head and shoulders suggests

Chainlink on the Weekly Timeframe LINKHitting a Macro Support. I drew many areas of interest out on the chart for places to look for the price to turn and move about.
Pretty Straight forward. We are coming off a major support while the rsi is forming an uptrend.
I dont know much about the fundamentals of this token, this is more for the TA specifically.
Please Comment!
Absolutely Not Financial Advice
Do your own DD

LINKUSD - Strong Trend Line UpStrong up trend line in solid white line with bottoms along the dotted line also which provides support.
Very bullish with support maintained.

Buy LINK Sell FIAT... LINK about to make a big move!!!I only have the basic tradingview account
But while using the free trial feature on 'coinigy'
I made a discovery?!?!?!
Poloniex
Chainlink / USDT pair
4hr or Daily or weekly chart
April 14th date
What do you see?
Be objective
Too easy
R:R 3:1
S/L 12.64
T/P $36+
Enjoy

Buy on the Full Sell on the NewJust a simple , not-guaranteed way. but usually profitable of trading Chainlink according to the phases of the moon
Buy on the Full Moon, Sell on the New Moon. Thats it nothing else to it.,

Short LINKPutting this out there for anyone who wants to pick a fast trade...you can check out the time of posting before getting it so you aren't late. Good luck
LIMIT is the game changer!

CHAINLINK NEW ALL TIME HIGH IN 2024?I've identified a bullish megaphone pattern forming on the weekly BIST:LINK chart 📈. This technical pattern is characterized by expanding price swings and higher highs paired with lower lows, indicating increasing volatility.
What does this mean?
A bullish megaphone pattern suggests a potential breakout to the upside. As the price consolidates within this widening range, the market could be gearing up for a significant upward move.
🔍 Key Points to Watch:
Higher Highs & Lower Lows: The expanding range signifies growing investor interest and potential for higher volatility.
Breakout Potential: Keep an eye on the upper trendline. A breakout above this resistance could signal a strong bullish move.
Volume: Watch for an increase in trading volume, which often accompanies breakouts.
As always, make sure to do your own research and consider your risk tolerance before making any trading decisions. This pattern is just one piece of the puzzle in technical analysis, but it’s definitely one to keep on your radar.
Stay informed, stay profitable! 💹
#Chainlink #LINK #Crypto #BullishMegaphone #TechnicalAnalysis #CryptoTrading

LINKUSD: Rallying Back to $20 | 72.73% Confidence!COINBASE:LINKUSD has been drawing a lot of attention in the crypto space in the past few days. It experienced a significant drop in price (-47%), but now it's starting to show signs of a potential rebound and might be heading bullish again.
Here's the breakdown:
COINBASE:LINKUSD price took a major hit over the past 2-3 months and has been consolidating since. According to my Free Probability Indicator , There's a 72.73% chance it could climb back over $20, which is pretty much encouraging!
This price drop might actually be beneficial as it presents a great opportunity to buy LINK at a lower price.
If you're thinking about trading LINK, here's what you should consider:
Entry:
Wait for clear signs that the price is going up again, like huge up-move candle showing strong positive movements on the daily chart.
Once you're confident the trend is changing, consider buying LINK.
I'm currently looking at the 4H Equilibrium to get positioned.
Exit:
To protect yourself from drawdowns, consider setting a "trailing stop-loss." This will automatically trigger a sell order if the price starts dropping again after you buy, securing your running profits.
Risk Management:
Ensure you're not risking more money than you can afford to lose.
Only invest what you're comfortable with and consider how much you're willing to lose if things don't go as planned.
This isn't financial advice, just some insights to help you make informed decisions. Always do your own research before investing in anything.

Chainlink Breaks Through: Trading Volume Fuel 9% SurgeChainlink (LINK), a prominent player in the decentralized oracle network (DON) space, has defied the broader cryptocurrency market trend with a significant price increase. On May 25, 2024, LINK surged by an impressive 9%, surpassing the $17.50 mark for the first time in six weeks (as reported by Will Izuchukwu). This positive movement comes amidst a period of relative stagnation in the overall cryptocurrency market.
Analysts attribute this rally to a confluence of factors, with two key drivers emerging:
1. Increased Trading Volume: A significant surge in trading volume often precedes or coincides with price increases. In Chainlink's case, trading volume over the past 24 hours has jumped by a staggering 78%. This heightened activity suggests renewed investor interest in LINK, potentially fueled by optimism surrounding the project's future or short-term trading strategies.
2. Positive On-Chain Metrics: Beyond trading volume, on-chain metrics provide valuable insights into the health and activity of a blockchain network. While the specific on-chain metrics
influencing LINK's price increase remain unreported in the provided excerpt, a positive trend in these metrics could indicate:
• Increased Use of Chainlink Network: A rise in the number of active users or transactions processed on the Chainlink network suggests growing adoption and demand for its oracle services. This would be a positive indicator for the project's long-term viability.
• Active Development: On-chain metrics can also track development activity on the network. An increase in such activity suggests the Chainlink team is actively working on improvements and new features, potentially leading to future growth.
Possible Explanations for the Rise
While the specific details behind this surge are unknown, here are some potential explanations to consider:
• Market Speculation: The broader cryptocurrency market has been experiencing a period of consolidation following recent volatility. Some investors might be seeking opportunities in undervalued projects, potentially leading to increased buying pressure for LINK.
• Positive News or Developments: News of partnerships, integrations, or upcoming protocol upgrades for Chainlink could have sparked investor interest and buying activity.
• Technical Analysis: Technical analysts who study historical price charts and trading patterns might have identified bullish signals for LINK, leading to increased buying from this group of investors.
Looking Ahead: Can Chainlink Sustain the Momentum?
Whether Chainlink can sustain this momentum remains to be seen. The cryptocurrency market is notoriously volatile, and short-term price movements can be difficult to predict. However, the factors driving this surge - increased trading volume and potentially positive on-chain metrics - paint a cautiously optimistic picture.
For long-term investors, the key will be to monitor future developments within the Chainlink ecosystem. Continued growth in network adoption, active development from the team, and positive news flow can all contribute to the project's long-term success and potentially lead to further price appreciation for LINK.
Conclusion
Chainlink's recent price increase signifies a positive development for the project in an otherwise stagnant market. Increased trading volume and potentially positive on-chain metrics are encouraging signs. However, sustained growth will depend on the project's ability to continue delivering value and attracting users to its decentralized oracle network.

Chainlink Set to Skyrocket: Is $22 Just the Beginning? The current price of Chainlink is fluctuating between $16.83 and $16.94, showing a significant bullish momentum over the past week with a performance gain of approximately 27.37%. The technical indicators reveal a strong upward trend with the price pushing through key moving averages and maintaining a bullish stance.
The RSI is currently at 67.65, suggesting that the asset is approaching overbought territory but is not yet overextended. This indicates room for further price increases before potential corrective actions. The Stochastic %K is also high at 91.29, reinforcing the RSI's stance but cautioning for potential short-term corrections.
The CCI is notably high at 214.61, which generally signals an overbought condition and a potential pullback. However, the strong momentum and MACD levels suggest sustained bullish sentiment. The EMA and SMA values across different periods all indicate a buy signal, reinforcing the ongoing bullish trend.
Price Targets
Immediate Resistance (R1): $17.62
Secondary Resistance (R2): $22.10
Immediate Support (S1): $14.78
Secondary Support (S2): $10.30
Given the current bullish momentum and the indicators' positions, a speculative price target within the next week could be $17.62, aligning with the immediate resistance level. If the bullish momentum continues unabated, a medium-term target could extend towards $22.10. Conversely, if a correction occurs, the price might pull back to the $14.78 support level.
Trading Strategy
Long Position: Consider entering a long position at current levels ($16.83 - $16.94) with a target price of $17.62. Place a stop loss just below the $14.78 support level to mitigate potential losses.
Short Position: If the price fails to break above the $17.62 resistance and shows signs of reversal, a short position could be considered with a target price of $14.78. Place a stop loss slightly above $17.62 to prevent excessive losses in case of a bullish breakout.
Conclusion
Chainlink exhibits strong bullish momentum supported by favorable technical indicators. Traders should remain vigilant for any signs of reversal near the resistance levels and consider both long and short positions based on price action around these key levels. The overall sentiment remains positive with the potential for further upside gains in the short to medium term.
Retest Weekly GaussianWe successfully retested and bounced off of the weekly Gaussian channel. Looks like the next major resistance is around 36 dollars. Will likely hit it in July. If we break it, next stop is near all tike highs!

Link bullish or bearish - A technical analysis
Support Levels:
$12.09: A key support level currently holding the price.
$11.06: Another potential support level below $12.09.
$8.40: Further support if the price breaks below $11.06.
$5.13: Major historical support level.
Resistance Levels:
$27.36: Immediate resistance.
$37.05: Next significant resistance level.
Trendlines:
-The chart shows an upward trending channel with support and resistance lines indicating a long-term bullish trend.
-The price recently bounced off the lower support trendline and is moving towards the resistance trendline.
The most recent monthly candlestick is bullish, indicating positive price movement and suggesting a potential continuation of the upward trend.
The Stochastic RSI at the bottom of the chart is in the overbought territory, which could suggest a potential short-term pullback or consolidation.
Bullish Scenario:
If the price maintains above the $12.09 support level, it is likely to retest the $27.36 resistance level.
A break above $27.36 could lead to further upside towards $37.05.
Bearish Scenario:
If the price fails to hold the $12.09 support level, it may find the next support around $11.06.
A break below $11.06 could lead to a drop towards $8.40 or even $5.13.

Chainlink's CCIP: Buy the Rumor, Sell the NewsPotential summer slowdown
There's been a noticeable uptick in criticism towards Chainlink on X, with the prevailing narrative questioning the necessity of the BIST:LINK token. I anticipate downward pressure on BIST:LINK due to Bitcoin's influence, potentially exacerbated by the voices of skeptics, who will cite CCIP GA as a failure. While this may lead to a dip in sentiment and price, it could also present better opportunities for investment.
On the chart, a nice head and shoulders with declining volume, as well as resistance from the Bull Market Support Band and the previous trendline starting in early March.

Five year view on LinkLink was one of the darlings of the last bull run. It’s story includes crazy volatility, stories of “Link Marines” blowing out Zues Capital out after its short and distort narrative fell apart. I suspect Link will once again be a darling of this new bull cycle.
cointelegraph.com
Analysis
The meat of the idea is from the main chart. We have hidden bullish divergence on the log MACD as well as the RSI. Hidden bullish divergence suggest a uptrend will continue. There is a higher low on the price but a lower low on the indicator. The green arrows show that very clearly.
The RSI getting to above 70 can signal overbought on a time frame but it can also signal that the bulls are in control of the price action. The log MACD is above zero once again. Both are very bullish indications that momentum is shifting fully bullish.
I favor using two Keltner channels, one set with the ATR at 1 and one set at 2. It helps be visualize when price is in between and make some conclusions. In order to “break” a weekly Keltner channel we need months if not years of price action creating a formation we can play.
I am just going to keep it as simple as possible. Link had a Elliot wave impulse and has completed its ABC correction. That is the structure we need to break the Keltner channel and push it upward. The chart below shows that twice link lost over 60% of its value when it corrected. So there are going to be discounts on the way back up. These relative bear markets lasted several hundred days and that can really weaken people’s hands.
Since we are using elliot wave the primary targeting technique I am using is major fib extension levels. I have only shown a couple on the main chart for simplicity but I expect action at almost all major fib lines. Stalls, retraces, all the normal drama.
Looking to buy the lower half of the Keltner channels seemed to have worked out for long term investors between 2018 and 2021. It was only when we put in the lower high at point B that strategy meant you were out of the money for a long time.
My plan
I plan on having Link be a major holding going forward. I plan on watching some tokens against Link (sol, xmr, ftm, etc) and trying to do some rotations or buying the alts when they have bullishness against link. In the long run I hope to pull close to 200x out of link with no margin.
