Long trade
12th May 24
Sunday
London Session
04.00am
Entry 13.370
Profit level 14.594 (9.15%)
Stop level 13.145 (1.68%)
RSI as base of Zone 1Hr TF
LINKUSD.P trade ideas

Short trade
13th May 24
15.00pm
New York Session
Entry 13.434
Profit level 13.076 (2.66%)
Stop level 13.555 (0.90%)

LINK - Will History Repeat??This Shambles of a chart .... lol
Anyway, i'm curious to see what people think Chainlink can do this run?
For the moment it seems to be following a similar overall pattern and has some of the biggest support behind the scenes towards tokenisation.
Can we we see a parabolic rise or are we looking more on the conservative side?

LNK/USDTGood Zone for buy.
we are in a second wave of big Elliott wave pattern and we have a anti-shark harmonic pattern.

$LINK Bull Trap Incoming Death CrossI'm super bullish on BIST:LINK long-term but this is honestly one of the worst charts of the majors rn
crazy to see analysts calling this bullish today
we'll see a Bull Trap from those 3 White Soldiers
Price action below the 20, 50 and 200 Moving Averages
If we get that Death Cross on the 200MA D then its straight to $10.6

Link selling complete ? Like everyone else, I’m just guessing,
Good luck with your bags
Could be cope


Chainlink (Linkusdt)Link displayed classic price action. it was accumulated for 15-18 months straight once the phase has completed price entered into public participation phase and right after as we expected currently, it is consolidating phase once it over we will again see the public participation phase which will take to the current supply and all time high price.
Thank you for reading.

Chainlink (LINK): Oversold and Undervalued. Surge to $37+Finally, after a long wait, we got filled on Chainlink, and we entered at $12.93. This is our entry point. The entry is holding up quite well and solid so far. We still see strength in Chainlink and we do not believe that our large stop-loss will be triggered. Also, for the first time since May 2022, the RSI has fallen into the oversold area, which is another sign of how strongly Chainlink has been sold off. We are holding on to this and still expect an increase to at least $37.45, probably even to $47.45.

LINKUSD: Potential Long Entry on the Horizon with Bollinger BandIntroduction
Chainlink (LINKUSD) is a cryptocurrency that powers a decentralized oracle network for smart contracts. It provides a secure and reliable way for blockchain applications to access off-chain data, enabling a wider range of functionalities. This article analyzes LINKUSD through the lens of Bollinger Bands and a potentially reversing trend, suggesting a possible long entry opportunity in the near future.
Understanding Bollinger Bands
Bollinger Bands are a technical analysis indicator that utilizes volatility to depict potential price movements. They consist of three lines:
• Simple Moving Average (SMA): This line represents the average price over a chosen period.
• Upper Bollinger Band (UBB): Two standard deviations above the SMA, indicating potential resistance areas.
• Lower Bollinger Band (LBB): Two standard deviations below the SMA, indicating potential support areas.
The Bollinger Bands expand and contract based on volatility. High volatility widens the bands, suggesting a more volatile market, while low volatility narrows them, indicating a calmer market.
LINKUSD and Bollinger Bands
Analyzing the LINKUSD chart with Bollinger Bands reveals valuable insights:
• Recent Price Movement: LINKUSD has been trading within a relatively tight Bollinger Band range for the past few weeks. This suggests a period of low volatility, with price movements largely contained within the bands.
• Squeeze: The recent Bollinger Band contraction indicates a potential squeeze. Squeezes often precede significant price movements, either upwards or downwards.
Reversing Trend Signals
Technical indicators alongside Bollinger Bands can strengthen the long entry case for LINKUSD. Here are a couple of reversal signals to consider:
• Relative Strength Index (RSI): The RSI is a momentum oscillator that measures the magnitude of recent price changes. An RSI value below 30 suggests the asset may be oversold, potentially indicating a trend reversal.
• Moving Average Crossover: A bullish crossover occurs when a shorter-term moving average crosses above a longer-term moving average. This can signal a shift in momentum from bearish to bullish.
Combining Bollinger Band Squeeze and Reversal Signals
By combining the Bollinger Band squeeze with potential reversal signals from indicators like RSI and moving average crossovers, traders can identify potential long entry opportunities.
• Breakout from Upper Bollinger Band: A breakout above the Upper Bollinger Band, following a squeeze, can signal a bullish trend reversal. This suggests the price may overcome resistance and continue upwards.
• Increased Volume: If the breakout is accompanied by a surge in trading volume, it strengthens the bullish case, indicating increased buying pressure.
Why Consider a Long Entry Now?
Here are a few reasons why a long entry in LINKUSD might be worth considering based on the current technical analysis:
• Bollinger Band Squeeze: The recent squeeze suggests a potential breakout, which could signal a trend reversal.
• Oversold RSI: If the RSI dips below 30, it might indicate oversold conditions, making LINKUSD an attractive buying opportunity.
• Positive Developments in the Chainlink Ecosystem: Positive developments within the Chainlink ecosystem, such as new partnerships or integrations, could boost investor confidence and lead to a price increase.
Important Considerations Before Entering a Long Position
While the technical analysis suggests a potential long entry, it's crucial to consider other factors before making any investment decisions:
• Market Volatility: The cryptocurrency market is inherently volatile. Price swings can be significant, and unexpected events can disrupt even the most well-thought-out trading strategies.
• Fundamental Analysis: Don't solely rely on technical analysis. Conduct fundamental analysis to understand Chainlink's project roadmap, team, and overall market position.
• Risk Management: Always implement proper risk management strategies, such as stop-loss orders, to limit potential losses.
Conclusion
The combination of Bollinger Band squeeze, potential RSI oversold conditions, and a possible trend reversal suggests a long entry in LINKUSD might be on the horizon. However, remember that technical analysis is not a foolproof method, and fundamental analysis and risk management are crucial for informed investment decisions.
Disclaimer: This article is for informational purposes only and should not be considered financial advice. Please consult with a qualified financial advisor before making any investment decisions.

Chainlink What Now?Is this move a surprise not really if you been following my Chainlink ideas.
Published in February warning traders that giant rising wedge had formed and the target of that wedge is back to the top of the massive range at 8-10 dollars.
March 18th we got a bearish cross the MACD , this was another signal of things to come.
On the LINK/BTC we can see that we hit the exact bottom of June 2023 lows when Chainlink hit 5 dollars and completed its wave 5.
We also have this very important date coming up with LINK , which is April 22nd 2024 or more like the week instead a specific day. This Fib time sequence has predicted Chainlink event for years with 100% succuss rate , check it out below
We once again get to see if proves to show us something of value.
On the Main chart above you can see this time fib sequence once again showing pivot points on the weekly , showed us all time high , June 2023 low , I mean simply amazing sequence here apart from 3.618 in grey you can see failed to produce anything special.
Even though the target for the rising wedge is 9-10 dollars I would link to see LINK hold the 1/1 Gann Fann right now its sitting right on it so we don't want to see a close under that would be pretty bad to close under the 1/1 again.

Chainlink : Rocket Launch or Freefall?Looking at Chainlink on the daily chart, we've noted the development of a 5-wave structure from a low at $5, culminating in a Wave 1. This wave is projected to range between $20.3 and $25, currently aligning well with the $20.3 mark. Following this, we anticipate a retracement towards Wave 2, which is expected to fall between 50 and 78.6% retracement, landing somewhere between $12.87 and $8.4.
Zooming into the 4-hour chart provides a clearer view, suggesting that Waves 3 and 4, particularly Wave 3, have likely concluded. We're now observing Wave 5, which appears poised for a slight upward trajectory, an action that might seem minor on the broader chart. However, on this more detailed chart, we predict an ascent up to a maximum of $22.46, though, as indicated by our analysis on the daily chart, a push up to approximately $25 is also within the realm of possibility.

Chainlink Finally Retreats: A Technical AnalysisIntroduction:
After prolonged sideways movement throughout the bear market, Chainlink ( COINBASE:LINKUSD ) experienced a notable surge, rallying from $4.8 to a peak of $22.9. This rally included extended periods of lateral trading, eventually reaching a critical resistance at the 4.618 Fibonacci extension level. Such a vigorous move typically warrants a period of consolidation or retracement, which appears to be occurring now, as evidenced by a sharp drop with a $4 candle observed today.
Current Market Overview:
The recent performance of Bitcoin ( INDEX:BTCUSD ) suggests a strategy of liquidating long positions followed by short positions, potentially targeting a brief spike to $72,000 before resuming a downward trend to $58000. This macro environment is crucial for understanding potential influences on altcoins like Chainlink.
Chainlink’s Price Action Analysis:
Chainlink’s recent rally hit a peak at the 4.618 Fibonacci extension, a common reversal point for assets after a strong bull run. This level has historically acted as a strong resistance zone, prompting profit-taking and a subsequent decrease in price pressure. The current retracement is not unexpected; after the exhaustion of a steep ascent, a correction phase often follows. The recent sharp drop in price could indicate an accelerated correction phase, possibly influenced by broader market conditions tied to Bitcoin's movements. Chainlink's price trajectory suggests it may be moving to complete wave B of its corrective pattern above $20, before potentially settling into a more substantial correction phase.
Forecast and Strategy:
Given the Fibonacci retracement levels and the current market dynamics, Chainlink could find its next support within the 'Golden Pocket,' the zone between the 0.618 and 0.65 Fibonacci retracement levels. This would place Chainlink's price in the $11-$12 range, representing an ideal target for the end of its correction phase. Traders should monitor Bitcoin's movements closely, as any significant fluctuations could have cascading effects on altcoins, including Chainlink. Establishing positions near the support levels, particularly around the $11-$12 range, could offer substantial opportunities for accumulation, with set stop-loss orders to manage risk effectively.
Conclusion:
Chainlink's market behavior demonstrates a classic cycle of rally and correction influenced by its Fibonacci levels. The projected continuation of this pattern suggests a buying opportunity may arise as the asset reaches its next major support zone. Traders and investors should stay attuned to both Chainlink's price movements and the broader market trends, as these will be crucial in determining the optimal points for entry and exit.
Key Takeaways:
- Chainlink reached a major resistance at the 4.618 Fibonacci level, prompting a correction.
- The $11-$12 price target in the Golden Pocket offers a potential accumulation point.
- Bitcoin’s market movements remain a significant influence and must be monitored for correlated impacts on Chainlink.
- Establishing buy positions near support levels with appropriate risk management strategies is advisable.

Chainlink Giant Rising Wedge formed.Rising wedge target is back to top of chainlink accumulation range at 9.3.
Clear rising wedge pattern with two touch points top and bottom.
We are coming up to the Chainlink fib sequence I have been using for years it has a 100% win rate at predicting Chainlink events , major moves , bottoms or tops.
Last Fib time hit was the Big move down in May 2022 marked a major bottom for LINK. Next one is April 22nd 2024 and anything can happen for LINK around this time , its interesting also that it lines up with the Bitcoin halving.
LINK/BTC
Link has failed to break this level time and time again and until this level is broken I don't think we will see a major move for LINK.
It is possible that coming in 22nd of April we get a big move down for on LINK/BTC to test the 1/1 Gann fan again, yellow circle you see on the chart.
If thats the case then expect a major move down the fact that we are forming such a massive rising wedge with only 60 days from the next count is telling.
I also get a two different Fib time dates on 22nd April the one use see above is completely different start and end points yet the 618 falls on the same date.
Maybe LINK breaks the resistance on this date and moons or maybe it crashes and bottoms , who knows! all i know is that the next date after Aprill 2024 is May 2027 so best be ready for anything .

CHAINLINK: Potential for 20.20 Target, Drop to 15.00 possibleHi there,
CHAINLINK has the potential to reach the second supply area around the 20.20 level and drop for a retest around the 18.77 before commencing up to the 21.00 major supply area.
And a potential drop from 21.00 could follow to 15.00.
If the current candle structure drops from the support level, breaches the demand zone, and breaks 15.69, that will invalidate the setup.
Happy Trading,
K.

LINK USDTLINK USDT looks sideways thus taking trade on either side of the breakout. in this setup one cancels the other i-e if price breaks upwards than long order is triggered and short order is cancelled and vice versa.

Secure Data Oracles: Chainlink's Decentralized NetworkLINK is in a bullish trend with an RSI around 64. It has support at 16.79 and resistance around 21.76, indicating the need to break out of resistance to maintain its bullish momentum. Currently, it's undervalued, with the potential for a breakout if it surpasses resistance.

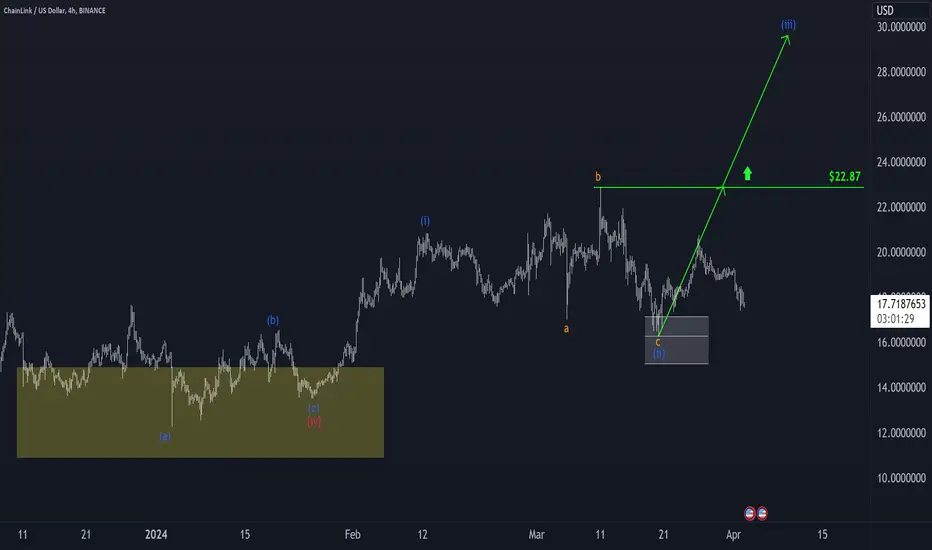
Chainlink: Start-up Difficulties 🚗💨LINK experienced a significant setback recently. However, we interpret the recent development as part of the substructure of the blue wave (iii). As a result, the coin should recover in the near future. Then, it should gain to levels above $22.87.
$LINK Monthly Roadmap playing out nicelyThis is one of the best looking monthly charts of any asset out there.
Looking strong for a sustained move higher.

LINK.usd eyes on $20: End of 5-waves? or one more leg to 23?LINK may have finished a 5-wave impulse wave around $20
The round number did try to reject, but we are back to it.
So It does seem ready to extend wave 5 another leg to $23
===================================================
.

Chainlink($LINK): Businesses and BlockchainChainlink, operating within the Ethereum network, plays a crucial role as an intermediary between traditional businesses and the rapidly evolving world of blockchain technology. In essence, it acts as a bridge, facilitating communication and interaction between non-blockchain entities and blockchain platforms. This unique position is akin to a translator ensuring seamless communication between two distinct worlds.
One of Chainlink's primary functions is enabling smart contracts, which are self-executing contracts with the terms of the agreement directly written into code. However, for smart contracts to be truly effective in real-world scenarios, they often require access to external data sources. This is where Chainlink steps in, allowing smart contracts to securely access and utilize real-world data, such as weather information, stock prices, or other relevant data points.
For instance, let's consider a decentralized insurance platform that offers weather-based insurance policies. Smart contracts on this platform need real-time weather data to determine whether certain conditions triggering insurance payouts have been met. Chainlink facilitates this by connecting the smart contracts to verified weather data feeds, ensuring accuracy and reliability in the execution of the insurance policies.
At the heart of Chainlink's ecosystem lies its native token, LINK. The LINK token serves multiple essential purposes within the network. Firstly, it acts as a means of incentivizing and compensating network operators who provide the necessary data feeds and maintain the integrity of the network. Secondly, LINK serves as collateral within Chainlink's smart contracts, ensuring the reliability and security of transactions executed through the network.
Furthermore, Chainlink operates as an open-source project, embodying principles of decentralization and community-driven development. This means that the project is transparent, and anyone can contribute to its improvement and evolution. Such openness fosters innovation and ensures that the network remains adaptable to emerging technological advancements and changing market dynamics.
Now, looking at the technical numbers, as of the latest available data, Chainlink (LINK) is trading within a bullish trend on the monthly timeframe since September 23rd where buyers have taken over. During this period, buyers have consistently been in control, driving the price steadily upward. The retail trading range for BINANCE:LINKUSDT is currently estimated to be between $37-$52, while the wholesale area is observed between $12-$5.
Chainlink's role as an intermediary between traditional businesses and blockchain platforms is pivotal in unlocking the full potential of smart contracts in real-world applications. The utilization of its LINK token as a means of incentivization and collateral further solidifies its importance within the ecosystem. Moreover, its open-source nature underscores the collaborative and decentralized ethos driving its development and growth. As blockchain technology continues to permeate various industries, Chainlink stands as a critical infrastructure facilitating this transformative journey.

Final Message 2 The World $LINKThe time is NIGH fellow BIST:LINK MARINES. This is my final message 2 tha worl. Tradingview wont let me post this in all caps because it appears to seem like im shouting.
