LINK to $230 - $1,087 ALT EW Count Stablecoin Supercycle Part 6!Genius Stablecoin Act just got passed! LETS GO! STABLECOIN SUPERCYCLE!
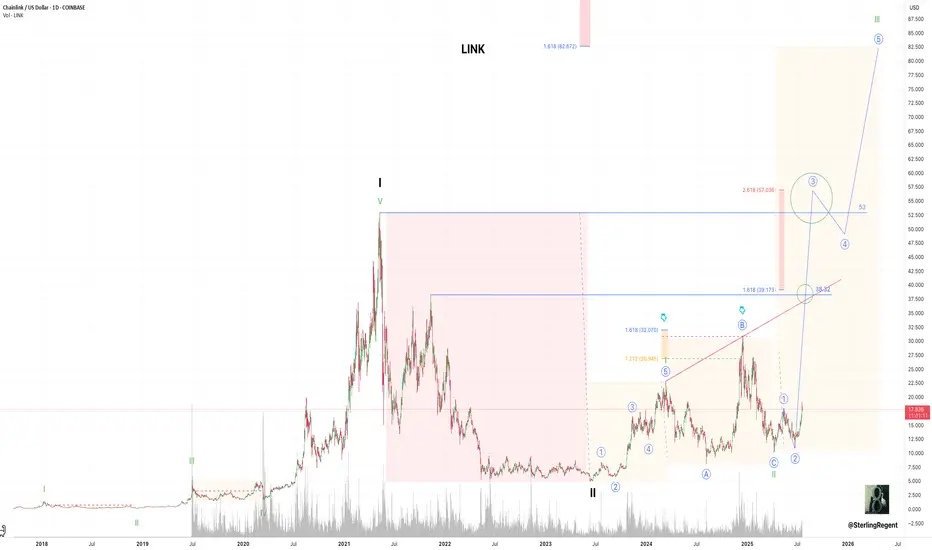
A few months ago I presented a Primary Elliott Wave Count that suggested Chainlink would top out between $60-$100. Here is the Alternative Elliott Wave Count that suggests that Chainlink will easily hit $230 this market cycle an
Key stats
About ChainLink
Based on the Ethereum network, Chainlink acts as an intermediary between non-blockchain businesses and blockchain platforms, which allows smart contracts to connect with real-world external data. Its LINK token is how network operators are paid and is also used as collateral in the network’s smart contracts. It’s also an open-source project, which means that anyone can contribute and suggest improvements to the network.
Related coins

The Oracle Singularity: CHAINLINK is Inevitable or Cooked?How many marines are tracking this ascending channel?
How many are watching this Fibonacci time sequence unfold?
How many are following the mirrored bar fractal that might just be a crystal ball into the future?
Today you get all three in one TA. The value here is absurdly high . Even though I offl

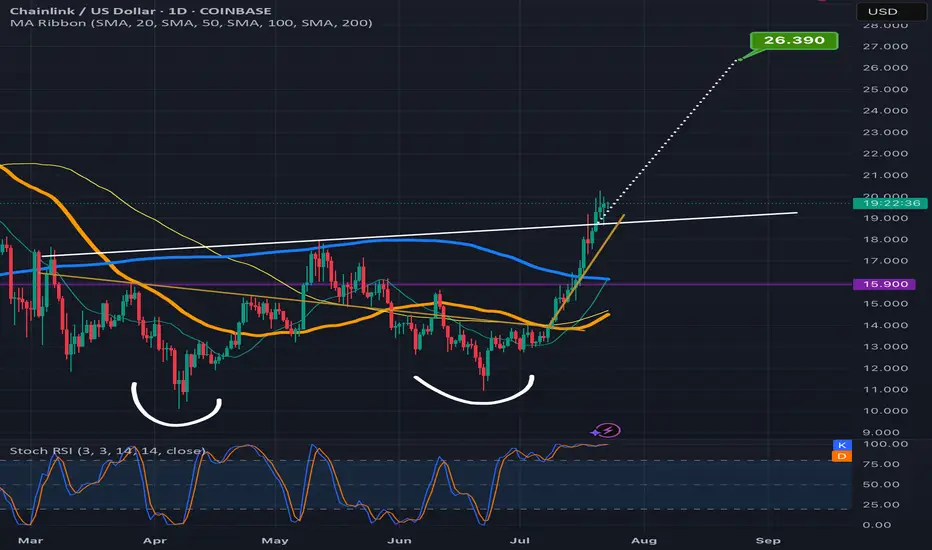
Chainlink climbing the measured move line staircaseLooks like Chanlink is ready to confirm the double bottom breakout here as the past few candles have already started to climb up the measured move line like a staircase.Always possible for a dip back below the neckline at this point but probability slightly favors the readout being validated instead
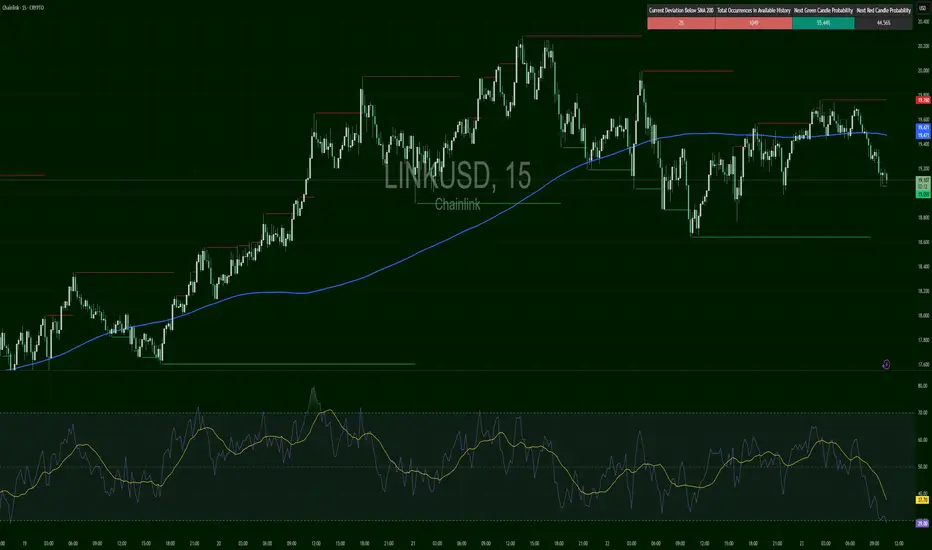
LINKUSD – Structure Snapped, Momentum GoneLINK broke trend structure clearly. After peaking around $19.76, it rolled over, crossing below the 200 SMA. RSI hit 30.54 — deeply oversold. Price is now compressing near $19.05. A rejection from $19.20–$19.30 would confirm bearish continuation. However, if RSI bounces above 40+ and price flips $19
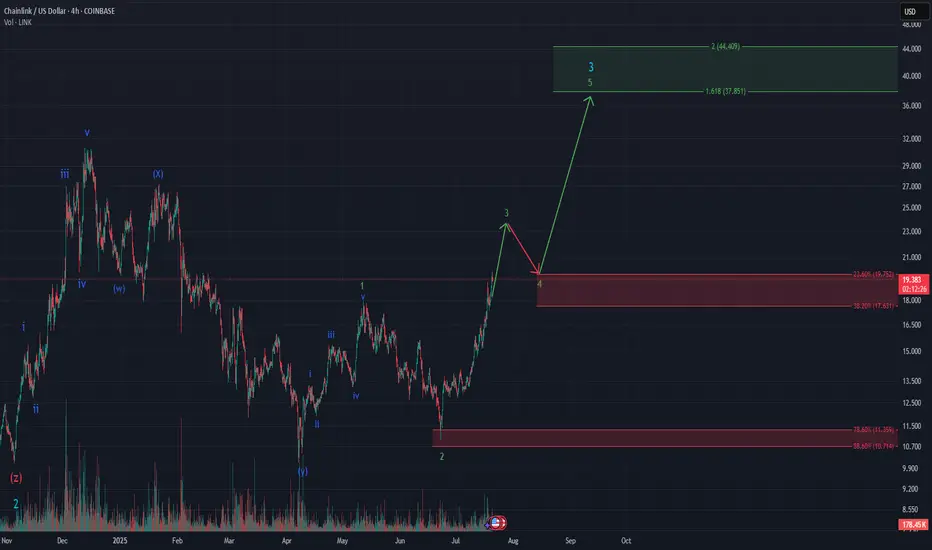
Chainlink – Deep Wave 2 Retracement / Powerful Wave 3?The current 4h chart on CRYPTOCAP:LINK is a textbook Elliott Wave setup – clean structure, impulsive momentum, and retracements that align beautifully with Fibonacci levels.
Wave 2 of the ongoing impulse retraced deeply – almost 88.6%, technically valid but aggressive. According to Neely’s Rule o
LINKUSD - Possible Correction from Channel ResistanceStructure: Ascending Channel
Indicators: RSI Overbought, Bearish Divergence Forming
📌 Confirmation:
Look for:
A strong bearish candle or
RSI breaking below 60
Volume divergence
Bias: Short-term bearish correction, bullish structure intact as long as price holds the channel.

LINK: Critical Chainlink Update!! | Stablecoin Supercycle Part 4🚨 New Video Just Dropped! 🚨
Today, I cover the latest Genius Stablecoin Act update, Shanghai’s surprising interest in stablecoins, and go deep into Chainlink’s technical setup — including Wyckoff, Elliott Wave, short-term outlook, and Fibonacci time analysis.
Video Timestamps:
0:00 Genius Stable

LINK - optimistic version.LINK may be finding itself in the beginning of a major proverbial wave III.
Chainlink Macro SurgeChianlink macro pattern triggered, fundamentally strong. Even though link is known for wild swings this is a spot hold to target $164.

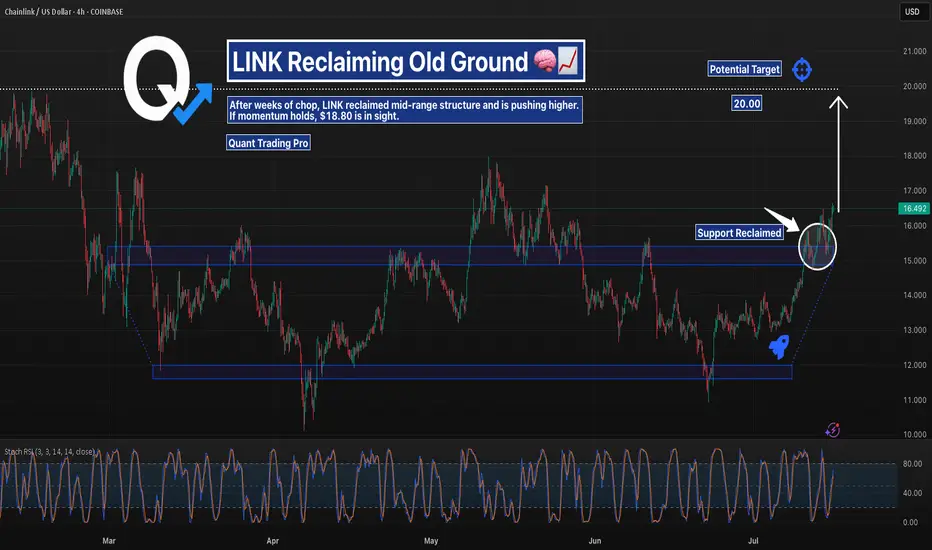
LINKUSD – Mid-Range Reclaim | Push Toward $18-20?Chainlink has reclaimed the mid-range supply zone between $14.50–$15.50 and is now pushing higher.
The structure looks clean with a potential target near $18.80 if bulls maintain strength.
Key support now sits around the breakout zone. Watching for continuation or a failed retest.
#LINKUSD #Chainl
See all ideas
Summarizing what the indicators are suggesting.
Oscillators
Neutral
SellBuy
Strong sellStrong buy
Strong sellSellNeutralBuyStrong buy
Oscillators
Neutral
SellBuy
Strong sellStrong buy
Strong sellSellNeutralBuyStrong buy
Summary
Neutral
SellBuy
Strong sellStrong buy
Strong sellSellNeutralBuyStrong buy
Summary
Neutral
SellBuy
Strong sellStrong buy
Strong sellSellNeutralBuyStrong buy
Summary
Neutral
SellBuy
Strong sellStrong buy
Strong sellSellNeutralBuyStrong buy
Moving Averages
Neutral
SellBuy
Strong sellStrong buy
Strong sellSellNeutralBuyStrong buy
Moving Averages
Neutral
SellBuy
Strong sellStrong buy
Strong sellSellNeutralBuyStrong buy
Displays a symbol's price movements over previous years to identify recurring trends.
Curated watchlists where LINKUSD is featured.

DeFi Tokens: Finance 2.0
24 No. of Symbols

ETH-based crypto: Find your utility
38 No. of Symbols

Gen 2: Crypto is here to stay - and it's brought some friends…
19 No. of Symbols

Interoperability Crypto: Communication station
14 No. of Symbols

Polkadot Ecosystem: Spot the best
19 No. of Symbols

Smart contracts: Make the smart decision
36 No. of Symbols

Top altcoins: Choose your alternatives carefully
28 No. of Symbols
See all sparks
Frequently Asked Questions
The current price of ChainLink (LINK) is 17.26 USD — it has fallen −5.63% in the past 24 hours. Try placing this info into the context by checking out what coins are also gaining and losing at the moment and seeing LINK price chart.
The current market capitalization of ChainLink (LINK) is 11.70 B USD. To see this number in a context check out our list of crypto coins ranked by their market caps or see crypto market cap charts.
ChainLink (LINK) trading volume in 24 hours is 1.04 B USD. See how often other coins are traded in this list.
ChainLink price has risen by 3.29% over the last week, its month performance shows a 34.21% increase, and as for the last year, ChainLink has increased by 195.04%. See more dynamics on LINK price chart.
Keep track of coins' changes with our Crypto Coins Heatmap.
Keep track of coins' changes with our Crypto Coins Heatmap.
ChainLink (LINK) reached its highest price on May 10, 2021 — it amounted to 53.15 USD. Find more insights on the LINK price chart.
See the list of crypto gainers and choose what best fits your strategy.
See the list of crypto gainers and choose what best fits your strategy.
ChainLink (LINK) reached the lowest price of 1.45 USD on Mar 13, 2020. View more ChainLink dynamics on the price chart.
See the list of crypto losers to find unexpected opportunities.
See the list of crypto losers to find unexpected opportunities.
The current circulating supply of ChainLink (LINK) is 1.00 B USD. To get a wider picture you can check out our list of coins with the highest circulating supply, as well as the ones with the lowest number of tokens in circulation.
The safest choice when buying LINK is to go to a well-known crypto exchange. Some of the popular names are Binance, Coinbase, Kraken. But you'll have to find a reliable broker and create an account first. You can trade LINK right from TradingView charts — just choose a broker and connect to your account.
Crypto markets are famous for their volatility, so one should study all the available stats before adding crypto assets to their portfolio. Very often it's technical analysis that comes in handy. We prepared technical ratings for ChainLink (LINK): today its technical analysis shows the buy signal, and according to the 1 week rating LINK shows the buy signal. And you'd better dig deeper and study 1 month rating too — it's strong buy. Find inspiration in ChainLink trading ideas and keep track of what's moving crypto markets with our crypto news feed.
ChainLink (LINK) is just as reliable as any other crypto asset — this corner of the world market is highly volatile. Today, for instance, ChainLink is estimated as 6.49% volatile. The only thing it means is that you must prepare and examine all available information before making a decision. And if you're not sure about ChainLink, you can find more inspiration in our curated watchlists.
You can discuss ChainLink (LINK) with other users in our public chats, Minds or in the comments to Ideas.