Call A Spade A ShovelIf you want the coin to go down the invalidation of my thesis is that the price sustainably goes below 50% in the tool or in other words perhaps below 2.5
LINKUSD trade ideas


LINK ($CHAINLINK) Price Rally to ContinueWhales have been the major contributors to the Chainlink price rally. The LINK could retrace partially before a rally to $20.
Oracle service provider Chainlink (LINK) has been one of the star performers in the altcoin space while clocking nearly 90% gains just over the last month. The LINK price is currently trading around $15 levels with its market cap around $7.9 billion.
Chainlink Whale Accumulation
The 200 largest chainlink whales have added huge quantities of LIBK coins over the last two days. Reportedly, they have been accumulating even before the 100% LINK price rally began.
Revisiting October 17th, when $Chainlink traded below $7.40, the 200 largest wallets swiftly accumulated an additional 40.18M $LINK. Two days after, the asset witnessed a remarkable surge of +125% in a span of 25 days, currently stabilizing around ~$14.60. The holdings in these wallets have sustained at elevated levels ever since.
After a strong price rally earlier in November, Chainlink is witnessing some sort of volatility over the last week. In the last 24 hours, the LINK price is down by 5.09% and is currently trading around $14.30 levels.
Chainlink appears to be on the verge of breaking out from a bullish flag pattern! A potential scenario involves a retest of the breakout zone around $14, paving the way for Chainlink ( BIST:LINK ) to advance toward the $20 mark.
SWIFT Collaborate With Chainlink To Transfer Tokenized Value
Swift’s successful collaboration with Chainlink and over 12 prominent financial institutions showcased the efficient and secure transfer of tokenized value across both public and private blockchains, facilitated by CCIP.
In this collaboration, Chainlink served as an enterprise abstraction layer, securely connecting the Swift network to the Ethereum Sepolia network. Chainlink’s Cross-Chain Interoperability Protocol (CCIP) played a crucial role in ensuring complete interoperability between the source and destination blockchains.

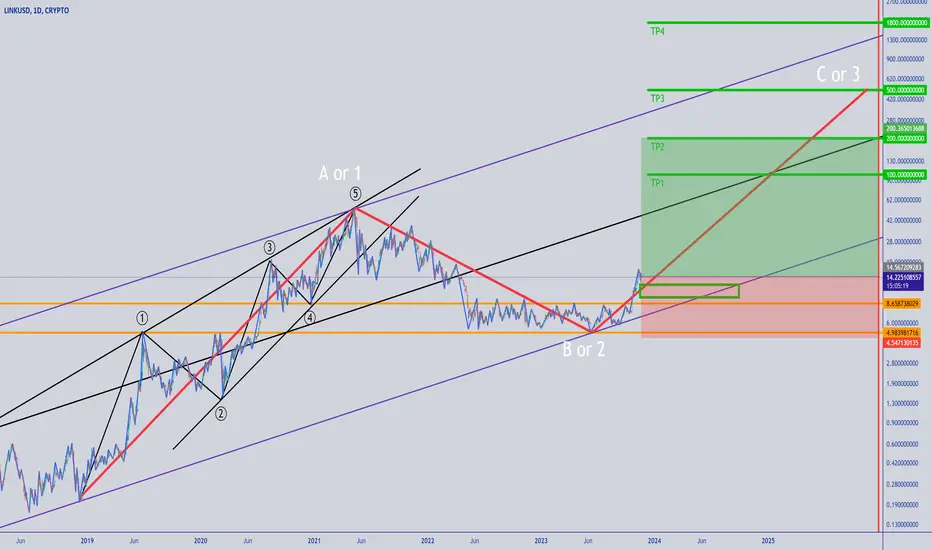
#cHAINLINK #Link Long-Term targets, until end of 2025#cHAINLINK #Link Long-Term targets, until end of 2025
According to Elliott's wave count indicated on the chart, the rise from 2018 to 2021 took place during a five-wave, where either wave 1 is bigger than a five-wave or wave A is bigger than a three-wave.
Considering the possibilities ahead, we can estimate the possible goals of Link until the end of 2025 as follows:
target1: 100$
target2: 200$
target3: 500$
target4: 1800$
entry: 15-10 $
stop loss: 4.55$
Seize the Potential of Chainlink with EMA 20 for Incredible Gai
I am here to present you with an exceptional opportunity that promises to revolutionize your portfolio and take your gains to unprecedented heights. Chainlink, a true gem of a project in the blockchain universe, has caught our attention and should undoubtedly catch yours too.
With its recent surge and the Extra Moving Average (EMA) 20 indicator looking remarkably attractive, the stage is set for an exhilarating adventure into the land of Chainlink. This golden EMA 20 - indicating a bullish trend - acts as a beacon for new buyers, beckoning them towards a potentially profitable journey.
Let me be clear - this is not just another hyped-up project! Chainlink has consistently demonstrated its strength and resilience within the market, boasting a strong track record and earning the trust of both traders and industry experts. Its fundamental technology, harnessing the power of smart contracts, ensures transparent and secure transactions with immense potential use cases across various industries.
So, here's the call-to-action - Join the Chainlink revolution NOW and witness your trading strategies soar to new heights! Seize the moment and embark on this thrilling journey with strength, courage, and conviction. Take advantage of the EMA 20 indicator, which tells a promising story about the future of Chainlink, showing great potential for substantial gains.
Whether you're a seasoned trader or just starting out, Chainlink promises an exciting adventure filled with astounding profit possibilities. Don't let this opportunity slip through your fingers. Embrace the spirit of exploration, the thrill of the market, and the allure of a technology that has the potential to reshape the way we interact with the digital world.
Ready to dive into the world of Chainlink? Take that leap of faith today! Let your trading journey be guided by the energy and excitement that Chainlink harnesses. Feel the surge of adrenaline as your profits skyrocket alongside the growing demand for this game-changing cryptocurrency.

chainlinkLink Update on the weekly I see a possible Mega Phone at play with critical support at 12.23 . if support breaks megaphone will be at play entering 5th wave. #link BIST:LINK #linkusd #linkusdt #cryoto #learn #chainlink

Chainlink #LINK Bullback scenario's, mini head & shoulders20-30% pullbacks are normal occurrences and healthy, to allow for profit taking , and also leverage traders to give back money to the market.
UP ONLY is a sign that the bullmarket is ending!
If everyone is winning
and everyone is in profit...
who is going to buy your coins?
So we can see the mini H&S with log and linear targets giving about a 30% pullback form the recent local high
Doesn't have to go all the way there of course and may actually reverse before the full target is met at around the $13 level ...

link wavescurrently consolidating in wave 4 of 3 target around 24, subsequent main wave 4 correction, rally in wave 5 to around 34
NFA
y axis only

Chainlink Accumulation RangeFrom May 2022 to the last week of October 2023 we were in an accumulation range for chainlink. Congrats to you if you were actively buying during this period. Personally, i've been buying small amounts consitantly throughout this range for the past year.
From the end of October we have exploaded out of this range and are currently at a key level around the $15 mark.
Will be looking for a pullback soon before continuation and add to my position.
Adding on pullbacks from here on out and will ride this back up to previous highs during 2024. Fingers crossed!

Chainlink (LINK) Remarkable 180% IncreaseChainlink (LINK)
In the past two months, LINK has seen a remarkable 180% increase, reaching a yearly high of $16.61. Currently, the asset has entered a phase of relative stability, oscillating within a sideways trading range between the support zone of $13.65-$14.32 and resistance levels of $16.00-$16.61.
Given Bitcoin's predominantly neutral or positive trajectory, the likelihood of LINK continuing its upward trend is high. The next targets for buyers are projected at around $17 and $18. In this scenario, a brief trading period within this range can be expected.
If Bitcoin undergoes a deeper correction, LINK might retreat to the buyer's level at $12.84 and retest the broader support range of $11.16-$12.03, which could present an attractive spot buying opportunity. This analysis assumes that BTC will sustain its ascending trend and secure a position above the $30,000 mark.

Link might have topped out at 16$Link outperforming ETH and BTC as well, but think it might topped around here.
I am looking to buy a dip into 9-10$ in the next 2-3 weeks. From there we should see new ATHs soonish (probably not within 2023, but somewhere around March-May 2024)
My target is 80$
Stay safe!

Flipping bearish channel 1. Symmetrical Triangle formed.
2. Weak follow thru formed bearish up slanting channel
3. Break through parallel bearish up slanting channel
4. Powerful upside due to shorts liquidated

LINK Price Alert and Call-to-Action for Patient TradersI wanted to bring to your attention an important development in the LINK market that requires your immediate attention. As an avid trader, I believe it is crucial to stay informed about potential opportunities and risks that may impact our investment decisions.
Over the past few days, I have been closely monitoring the Aroon indicator on the 2-hour timeframe for LINK. It has come to my attention that the Aroon is showing a significant drop, indicating a potential upcoming downturn in the price of LINK. While this may be concerning to some, I believe it presents an opportunity for patient traders like us.
Based on my analysis, I predict that LINK has the potential to hit $18 in the near future. However, it is important to exercise caution and approach this opportunity with patience. Market fluctuations can be unpredictable, and we must be prepared for potential volatility in the short term.
Considering the current market conditions and the potential for LINK to reach $18, I encourage you to consider a long position on LINK. However, it is crucial to approach this trade with a patient mindset, as it may take some time for the price to reach our target.
In light of this information, I invite you to carefully evaluate your trading strategy and consider adjusting your portfolio accordingly. By taking a long position on LINK, you can potentially benefit from the expected price increase. However, please remember to exercise proper risk management and set stop-loss orders to protect your investment.
Remember, successful trading requires discipline and patience. While we anticipate LINK to hit $18, it is important to be prepared for potential market fluctuations and to adjust your trading strategy accordingly. By staying informed and making well-informed decisions, we can increase our chances of success in this volatile market.
I encourage you to conduct your own analysis and research before making any trading decisions. If you have any questions or require further assistance, please do not hesitate to reach out to me. Let's stay connected and support each other on this trading journey.
Wishing you profitable trades and success in your investment endeavors.

Chainlink Educational Post - Finding Support And ResistanceMany of you have been asking me how I timed my NASDAQ:LINK trade so well. Purchasing at $7.63 on October 20th and now seeing it up to $16.20, I will say it was slightly lucky, but it was not random.
In this video I go over a few of my basic strategies for getting major price points out of an asset in less than 15 minutes.
Follow for more trading content. Exclusive videos will be released weekly.
Sorry about the AUDIO quality - Dont have a mic with me right now.
- Joshua
Helios Capital Investment

CHAINLINK/LINK UPDATES
PREVIOUS IDEA ARE ON SPOT.
This is not a financial advice,
Follow for more. The patience traders always win.
Thank you.
Im expecting retracement..

✴️ Chainlink Sideways Continues But... Where Are The Fruits?It has been the longest consolidation phase ever for Chainlink, so far a total of 475 days going sideways. Not up, not down, just sideways... Some people would say this is the worst.
Within this sideways channel we still have bearish and bullish waves. A medium-sized correction just took place and now we are preparing for a new bullish wave.
This new wave can end up right at the upper boundary of the channel or it can continue straight up. Regardless of the outcome, we will have a break from sideways action and will experience bullish growth.
We welcome change.
Positive continues to hit the market, it will soon start to add up.
Just like that, we went from bad to worse, from negative to terrible while Bitcoin continued to grow.
Now we are seeing the first pieces of positive news coming out and then, after 1-2 weeks of positive, the market catches up.
First the roots, then the trunk, the leaves, the flowers and the fruits.
This new market cycle already cemented its roots, in fact, I can clearly see a big trunk.
We are due to see some beautiful leaves and flowers, ripe fruits in 2024.
Namaste.

Chainlink Breakout!After a long, long time LINKUSD has broke out of its $5 - $9 sideways consolidation.
This has been over 500 days ! Quite the achievement! It's hard to stay patient but if you trust in the future of your investment you don't need to check it all the time and those days fly by.
Going forward (depending on BTC), LINK has built a strong foundation for itself and it's unlikely for LINKUSD to ever dip below $5 again. With the Bitcoin halving approaching in April 2024 there is potential of a sustained bull run where LINKUSD has a massive support advantage against other alt-coins. With it's current market cap, the capability of LINK is enormous.
However, fear remains among the U.S economy and markets (of a recession) as well as lingering in the crypto space from the recent long bear market and ongoing distrust. That being said, we are currently riding a short-term high and if BTCUSD were to fall , LINKUSD will go right back down with it to retest our strong support range.
Lastly a reminder: Chainlink has one of the strongest and trusted teams in the cryptocurrency space and has always been a favorite of outside the sphere interest. We must not get ahead of ourselves, but I remain long term BULLISH on LINKUSD and I'm excited for the future to come!

Link continuation after holdingGood morning traders.
Link ist still in a huge upward moving.
My take is 13.50 was already a huge level was getting broken now it should be time for a correction or at least a little break. After we looking forward to the 20 level. At that time BTC is almost at 37k take also care about this movement. I draw my levels below.
Trade safe and take care.

Rally is over - Short LinkShort Link
Take a small amount of short position and, for God's sake, maximum is 3x.
stop loss at 15.2
tp1 : 12
tp2: 10.85
tp3: 8.6

LINK-USD Wyckoff Accumulation in Progress...Remember our old freind Wyckoff from April 2021?
Well he may be back in an accumulating mood for LINK.
See you in 2024 when the dormant period ends.

Celebrating Chainlink's Remarkable 76% RiseChainlink has soared a staggering 76% to become the top-performing cryptocurrency of the moment. 🚀🎉
It's moments like these that remind us why we love being a part of the crypto trading community. The thrill of witnessing such remarkable growth and seizing profitable opportunities is truly electrifying. And with Chainlink's recent surge, it's time to ride this wave of success together!
If you haven't already considered it, now is the perfect time to explore the potential of long positions on Chainlink. With its impressive momentum and strong market presence, Chainlink has proven itself to be a force to be reckoned with. By going long on Chainlink, you have the opportunity to capitalize on this upward trend and potentially maximize your returns.
Here's why I think going long on Chainlink could be a game-changer for you:
1. Unprecedented Growth: Chainlink's recent 76% surge is a testament to its potential as a top-performing cryptocurrency. This kind of growth is hard to ignore, and by going long, you position yourself to benefit from further upward movements in its price.
2. Strong Market Presence: Chainlink has established itself as a trusted and reliable player in the crypto market. With numerous partnerships and integrations, it has proven its value and utility, making it an attractive choice for long-term investors.
3. Technological Innovation: Chainlink's cutting-edge technology, particularly its decentralized oracle network, has gained significant recognition within the blockchain industry. Its ability to connect smart contracts with real-world data is revolutionizing various sectors, including finance, insurance, and supply chain management.
Now, I don't want you to miss out on this incredible opportunity. Take a moment to assess your trading strategy and consider how going long on Chainlink aligns with your goals. Remember, the crypto market is highly dynamic, and staying ahead of the curve can be immensely rewarding.
If you need any assistance or have any questions regarding Chainlink or any other trading opportunities, please don't hesitate to reach out by commenting below. I'm here to support and guide you in making informed decisions that align with your trading objectives.

Some upcoming Chainlink Levels to watch.Just a follow up to my last post () so that people can click "play" and see how it plays out.

LINK Approaches $13 as it RetestsLINK token is on the move again, and it's approaching the $13 mark as it retests. This is a golden opportunity you don't want to miss!
If you've been following the LINK's impressive journey, you'll know that it has been one of the most promising and consistently performing cryptocurrencies out there. And now, it's gearing up for another upward surge, which has us buzzing with excitement!
Why should you get in on this action? Well, let me give you a few compelling reasons:
1. LINK has shown remarkable resilience and strength, consistently outperforming many other tokens in the market. Its track record speaks volumes about its potential for growth.
2. The retest at $13 signifies a crucial point in LINK's trajectory. Breaking through this level could open up a whole new world of possibilities, potentially propelling LINK to even greater heights.
3. By going long on LINK now, you position yourself to ride the wave of its upward momentum, potentially reaping substantial profits as the market responds to its bullish movement.
So, what's the call-to-action? It's simple: seize this opportunity and go long on LINK! Don't let this exciting moment slip through your fingers. Here's what you can do to take action:
1. Conduct thorough research: Dive into LINK's recent performance, market trends, and any other relevant factors that could impact its price. Knowledge is power, so arm yourself with information before making any decisions.
2. Consult with experts: Reach out to experienced traders, join online communities, or engage in discussions to gain insights and perspectives from those who have been closely following LINK's journey.
3. Develop a trading strategy: Based on your research and expert advice, create a well-thought-out plan that aligns with your risk tolerance and investment goals. Remember, a solid strategy is key to successful trading.
4. Execute your trade: Once you feel confident in your approach, it's time to take action. Open a position, set your stop-loss and take-profit levels, and keep a close eye on the market to make any necessary adjustments.
Remember, trading always carries risks, but calculated risks can lead to substantial rewards. LINK's potential for growth and the current retest at $13 make it an exciting opportunity worth considering.
So, gear up, fellow traders, and get ready to ride the LINK wave to new heights! Don't let this chance pass you by. Take action now and go long on LINK!
