$LINK; LONG SETUP- PENDINGHello friends,
This is a free of charge BIST:LINK setup for everyone to share and enjoy. However, this is PENDING and AWAITING for more confirmation. I will update all when the trade is a go and or no go.
Arguments- A beautiful bullish pat pattern has flew from the caves and printed a local double bottom right around the .786 fib which is the GOLD standard when looking for areas of potential reversal.
Now, we are above a infliction point, HOWEVER it is still awaiting that confirmation hence why the trade is still PENDING, as of now.
We see on the oscillator's that regular class a bullish divergence has also developed and is in the process of follow through i.e price action. My stop loss shouldn't be your standard, as everyone has different strategies, however this is something that I would do.
This is not trading advise and this trade is not active. This is me sizing up an asset and waiting for the alert to hit send ;)
GLHF
LINKUSD trade ideas

LINK! Confirming Initial Spring; UPSIDEOHHHH boy. This is where a position would be placed with a very small amount of risk.
Springs, backtests the spring successfully=continuation
Looks reallllllll goood

4HR: $LINK; Sizing Up- Too Much Demand?BIST:LINK at a key inflection point where sellers are trying to push price down, however buyers seem to be soaking up the demand and I would say it is a range bound asset between these areas. I pointed out 2 times via prior history where the demand shows to be too much for bears to bring down, as buyers push for a 10% mark-up once confirmation is in.
IF BIST:LINK can confirm that these lows are in fact the bottom of the range i.e the potential double bottom, history shows that link typically swings upward of 10% once the bottom is hit and support broken/confirmed
Just my thoughts and how one would use history to size up a asset and possibly put in a position and the arguments why.
Thanks for reading

LINKUSD LINK USD CRYPTO CFD on PEPPERSTONE
Higher local rejections aren't marked because they appear to be tested, if you're doubtful, mark them yourself.
Initial lows, supports, untested spots marked with hotpurple box. Testing support currently, also a local low has been created, either we regain it and hold to continue with the move up.. or more likely, break below and push on to retest initial lows that created this whole trend up.
Always refreshing charting a different ticker, removes imprinted biases, lets you acknowledge key spots, and removes all the bs.
Anyways, i'll be watching this ticker over the next week or two. Once again LINKUSD LINK USD CRYPTO CFD on PEPPERSTONE
gravy

1HR: $LINK; Bullish Rectangle- BOUNCE!NASDAQ:LINK did not let the bears break her down past this strong support and produced a nice bullish rectangle driven by bullish divergence on the MACD. IF LINK can spring, backtest local top of the structure and buyers demand, could make a good move.

LINK- long setup- waiting time is around 3 monthsplanning to wait for around 3 month before i go long on the link if the historical pattern from Jan- April 2019 repeated in real time.
i will use the weekly time frame to trade this trading set up.
will update in 8 weeks.

#link shorthello everyone, link just got rejected from the upper resistence. now we can expect a pull down little below we can open a short position.
Chainlink Update (The same playbook )Since October 2022 I have been getting things wrong with chainlink a lot , pretty much the only coin where I missed the target and time over and over . Most of the time its easier to trade Litecoin because it actually has organic movement.
Chainlink has not been moving organically in my opinion , there is no historical price movement that we can compare this sideways movement for over 400 days.
For me atleast it was looking like this was some sort of wyckoff accumulation period and we just had a spring event.
In my previous TA I tried to give traders a heads up that this was highly likely a coordinated move to get Chainlink at much lower prices.
It was very clear to me that this was the case just based on the wave of news and timing of the flash crash structure that came shortly after.
Its the same playbook over and over if its not a ETF to bring price up , its SEC hammer to bring it down or "China ban" or Elon musk selling btc holdings for tesla etc etc you get the picture.
So where are we now , still under the 1/2 Gann Fan , at 6.8 dollars Chainlink will be over the 1/2 Gann Fann , lets see if its start closing above it that would signal a big change for LINK in terms of market structure.
We also have this very nice support line here which until now I didn't notice , seems to be bouncing off this support for a long time.
As I posted in my previous post of LINK , my indicators have been flashing bullish divergence and 5 wave counts across the board.
This EW count suggests wave 5 is in and target is just under 8/1 Gann Fan , very interesting.
and finally we have the most important Chainlink chart , the LINK/BTC dominance last LINK TA I talked about potential hidden bullish divergence if it bounced on this trendline.
We got that bounce.
So to conclude here , never sell your Chainlink at these levels , there is clearly big things happening in the background , when a coin has coordinated attacks to dump price and goes into some sort of Wyckoff accumulation its extremely bullish long term it might not seem that way short term and its been a long road for LINK holders but the play in a bear/sideways market is always to load up on fundamentals .

Chainlink with plenty of Upside Potential1. Clear Accumulation after mark-down phase.
2. Weekly RSI Breakout & successful Retest.
3. Mark-up Phase due given where we are in the long term trend/cycle.

LINK Close to the $8 CrossroadsLINK Price action maintains a sideways trend in the weekly chart.
The recent 60% recovery within the channel faces resistance above $8.
Since last October, prices are yet to close above and test the resistance trendline.
However, the prices are yet to close above it.
If the prices manage to close above $8, Link prices can jump to $8, we can expect it to reach $9, close to the resistance trendline.
On the flip side, an evening start at $8 can restart a bear trend.

LINK ath reprice before halving?With polkadot capitulating to change narratives and chainlink's CCIP in testing
Chain link set to be the internet of blockchains w/ very little competition.
Prob like buying ethereum at in 2016 for $7. (actually the price i paid for my first eth btw)
Link finishes this cycle in the top 5 on crypto market cap?

Chainlink looking ready to ripI missed Link last run and I dont think it will produce those gains again but i will definitely get hot soon.

fractal apparent in latest chainlink cycle.the previous crypto hype cycle for chainlink launched a major cycle extending to it's 2.618 log target. this suggests the next cycle will hit a target of at least $230 and at maximum, $1-2k per token.
Remember to STAKE your link when you get the chance.

$LINK consolidation long targetsTargets marked on chart once breaks out of long term consolidation patter. For now accumulate at bottom and midpoint of the range.

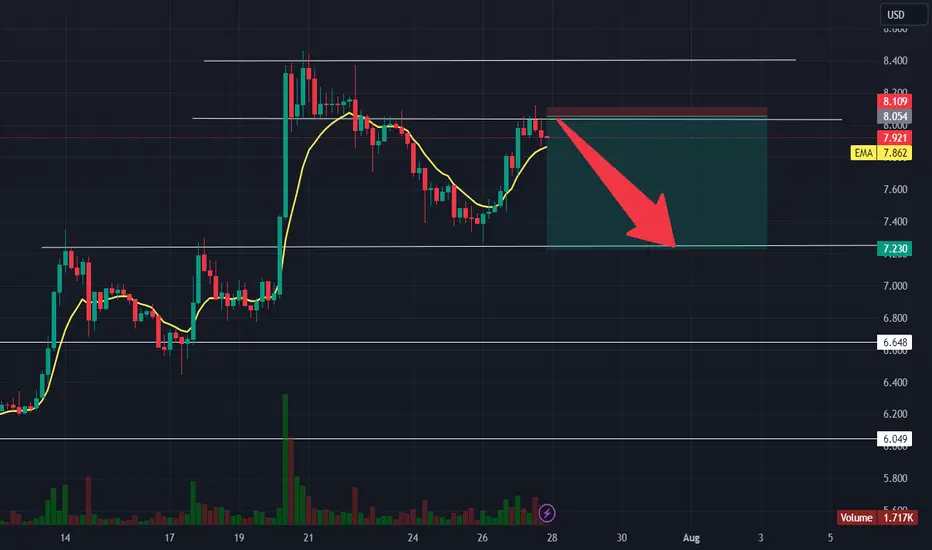
LINKUSD: Strongest day of the year testing the Channel's top.LINKUSD is having the strongest 1D candle of the year, turning the 1D time-frame technically overbought (RSI = 73.130, MACD = 0.370, ADX = 25.207). This rise may have taken the price above both the 1D MA50 and 1D MA200 but just hit the top of the 8 month Channel Down. Technically that is a sell signal, targeting the bottom of the High Variance Belt (TP = 7.000).
If the price crosses above the top of the Channel Down and invalidates it, we won't go long just yet, but rather wait for R1 (8.8000) to break and then buy aiming at R2 (TP = 9.65000).
A weekly closing over the R2, justifies a long term hold position on LINK.
## If you like our free content follow our profile to get more daily ideas. ##
## Comments and likes are greatly appreciated. ##

✴️ Chainlink On The Brink Of Bullish Explosion (78% Easy Target)The same situation I explained in the Polkadot (DOTUSD) trade idea, is taking place here.
The simplified repeated price action pattern has a variation on the LINKUSD (Chainlink) chart, instead of a higher low this year compared to last, we get a lower low which changes nothing.
Chainlink produced a lower low in June 2023 vs December 2022.
We have a strong bullish wave followed by a correction that is now leading to a new bullish wave phase.
The confirmation here comes in the form of the EMA50 indicator.
First, LINKUSD broke above it last month and now it has been tested as support and it holds. Trading above it opens the doors for sudden/fast growth.
The consolidation has been going for a while now, I think we only have a few days left before everything shoots up. The easy target is 78% on this one, more in the long-term of course.
Namaste.

LINK is soaring. Crypto local top soon. Usually when NASDAQ:LINK soars it is normally the final phase of the up swing.
Link is a perfect short opportunity in this case.
However, it seems like there's a connection with the Crypto market somehow.
Link goes up crazy 20%+ in a few hours then in a matter of days (sometimes hours) there would be a massive pull back in crypto market.
Be careful and manage your risk.
(information provided is only observations. Not a financial advice or actual facts)

Link chart analysis
my opinion is positive for Link. It seems that the price will increase until July.
Red and green areas show future support and resistance . 450$ is Link price target until the mid of 2025
After Doge and Chz I am very optimistic about Link.

Link on Poloniex ExchangePoloniex Exchange showed link at $0 for about 1 hour there was no volume in any of the surrounding candles. What does this mean? This really changes the structure of the chart. Is it possible we are getting ready for another drop towards $3?

ChainLink [Time to Shine]I've been wrong, just like everyone else in this space
Truthfully, I don't know why I feel the need to post this "call"
Perhaps it is my ego, wanting to be right
Anyway..
ChainLink looks ready to fly up from here
Why?
It accumulated for a few months, then ran below the old lows of the accumulations and has recently printed a buy signal.
Can you spot it on the chart?

BUY SIGNAL - MID TERM The information I share on this platform is based on my personal opinion and experience, and should not be considered as financial advice. You are responsible for your own investment decisions and should always do your own research before making any trades. I do not guarantee the accuracy or validity of any data or analysis I provide. Please use your own judgement and caution when following any call or signal I post. #imo
NOTE:
25% PROFITS AT EVERRY FIBONACCI RETRACEMENT LEVEL.
USE ISOLATED (FOR CRYPTO EXCHANGE)
USE CAPITAL RATIO (5 - 10 % OF YOUR CAPITAL)
DONT FOMO (FEAR OF MISSING OUT)
If you want to trade crypto successfully, you need to follow some basic rules. One of them is to use isolated margin for your trades. This means that you only risk a fixed amount of your capital for each trade, and you don't borrow more than you can afford to lose. This way, you can avoid liquidation and protect your account balance.
Another rule is to trust the process. Trading is not a get-rich-quick scheme, but a long-term game that requires patience and discipline. You need to have a trading plan and stick to it, regardless of the market fluctuations. Don't let your emotions get the best of you and don't chase unrealistic profits.
A third rule is to use capital ratio for your trades. This means that you divide your capital by 10 and use only one-tenth of it for each trade. This will help you diversify your portfolio and reduce your risk exposure. You can also adjust your position size according to the market conditions and your risk appetite.
Finally, a fourth rule is to avoid FOMO (fear of missing out). This is a common psychological trap that makes traders enter or exit trades based on hype or panic, rather than logic or analysis. FOMO can lead to overtrading, poor decision making, and unnecessary losses. You need to be confident in your own strategy and not follow the crowd blindly.
By following these four rules, you can improve your chances of success in crypto trading and enjoy the benefits of capital ratio.

✴️ Chainlink UpdateWhen I shared Chainlink more than a week ago it was trading at $5.56 and below EMA50, magenta line on this chart... Things are looking better now.
LINKUSD is trading above this level and the bias is 100% bullish.
This is a quick update, we can expect additional growth.
The upper channel should be tested but likely it will go higher in the weeks to come.
✔️ July will be bullish for Crypto/Altcoins.
✔️ July will be bullish for Bitcoin as well.
Namaste.

