LINKUSD - Bullish CypherSee chart. Lots of hopium.
Bullish cyhper, ichimoku looks good for a reversal to a sustained up trend.
Zooming out: there's a formation of an inverse head and shoulders. If wave 4 is a throwback on the H&S, wave 5 could extend to hit the H&S target. Of course this is all very speculative. Just ideas of a green future.
LINKUSDC trade ideas

LINK on long term trendlineLINK is moving on long term trendline which proved to be strong in the past. Above $20 level, LINK should get more strength, opposite, below trendline, the price will turn bearish. It is trading from oversold position, which is good entry point for accumulation. RSI momentum indicator is rising and closing on 50 level, indicating bulls are gaining on strength. MACD is also picking up, although still in negative territory. Intraday chart is still choppy and I’m waiting for a breakout on which I will take long position.

LINK will lots of room to the upsideZooming out to a seven-day period, most altcoins in the top 20 by market cap had outstanding returns and most of them outperformed Bitcoin. BTC.D dropped some 5% in last week, hinting a trend of swapping BTC for altcoins. LINK was one of them with massive 100% gain since 21st of July. The price skyrocketed at a breakout from falling wedge (red doted line).
The falling wedge is a bullish pattern that begins wide at the top and contracts as prices move lower. This price action forms a zone that slopes down as the reaction highs and reaction lows converge. In contrast to symmetrical triangles, which have no definitive slope and no bias, falling wedges slope down and have a bullish bias. However, this bullish bias cannot be realized until a resistance breakout occurs.
LINK is bullish in higher time frame but needs to break above major resistance at $30.20, after that the price will accelerate.
On daily and weekly chart, the price is forming a large wedge, which could play out somewhere around $80-$100 level (green box). It’s still too soon to call it, but that’s something I’m looking at in higher time frame.
Lower time frame is choppy, but still bullish. If BTC stays bullish or flat (just not sudden drop), then LINK should outperform. $30 is my fist TP, followed by $35 and $52. Ultimate target would be green box; 80$ - 100$, which could be reached in next several months. Supports are at $23, $15, and $13.350

LINK in a viewChainlink is on an ascending trend. Based on this analysis it has the potential to reach $66

LINK MIDTERM UPDATE - LINK ORTA VADE GUNCELLEMESee the charts for the details
Detaylar grafiktedir.
charts.cointrader.pro

Silly link moon chartLooks like link will finally break out of its ascending triangle and go to new glorious all time highs.
Defi is gaining new traction and hype, most of Defi will need to use Link or alternative oracles.
China's BSN, or Blockchain Service Network is also Integrating Chainlink oracles.
Good times ahead

CHAINLINK (LINK) /USD : I think of a new ATHThere is only two ways for an asset UP or DOWN
LINK is in a solide uptrend for years now.
After the last run up from 0.5$ to 4.5$ the coin has been ranging sidways...
All range must come to an end eventually either breaking up or breaking down.
The momentum of this coin is strong with no setback visible as of now.
I think this is an accumulation ragne until the next move higher. If the coin can trend above the last known resitance (2.82$) I expect new ATHs this year.
As the trend develope I will keep you fully updated.
disclamer: this is not financial advice and everyone involved in trading activities should know how to properly manage risk.


chain link breaking out ?on the chart, you will find some interesting information on what's going on

#LINKUSDC (Mid Term) RISKY #LINKUSDC (Mid Term)
Buy : 2.88420000 - 2.77604250 - 2.67194091
Target 1: 3.02051500
Target 2: 3.31683000
Target 3: 4.18209000
Target 4: 5.04735000
Stoploss: 2.58297686
Invest: 3%
Risk/Reward: 7% / 75%
we ask Allah reconcile and repay

Chain link pattrens / motifsChain link making an interesting pattern over and over again, creating a big of the same pattern in thus creating a reverse head and shoulder
breaking the 3.20 mark would be an epic move to the upside
Chain link faisant un motif intéressant encore et encore, créant un gros du même motif en créant ainsi une tête et une épaule inversées
Briser la barre des 3.20$ serait un mouvement épique à la hausse


chain link seems to love to fake out looking like we are in a nice triangle bin long for a wile ,might see a future divergence then a cup and handle .
chain link has bin running hard be nice to see this-cool down , seem doing its own thing

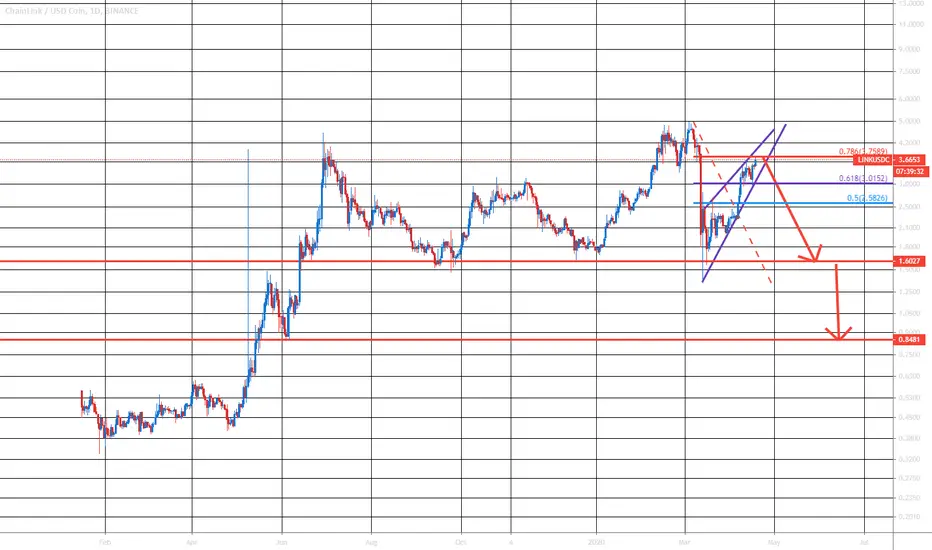
Link Potential Bullish CypherDaily Bearish Divergence on Link at a critical fib node. It is playing out as we speak. I don't recommend going short right now. But the best possible trade set up right now is at the pcz of the potential Bullish Cypher if we could ever get there. Risk/Reward and Exit/Stop's are depicted on the chart.
Twitter: twitter.com
If you want to be a loving supporter of me and my "ChArtworks"
$BTC: 35tmT7MAQXZm7rr1KzZMWNRpN2iyrnSB4z
$LTC: LVfCT9fu4dYyFAo5cW5xLrzHZHWFoG85hn
$ETH: 0x390d207b9bde62f2806caddfb94809de61da50d9
$x42: XZXm43FJcZHEVNs9dh8mdfzWyY6VfmJvPc
Donations are never required but they are greatly appreciated! Your Supportive comments and follows are just good enough too :D <3
Join the best Crypto and Technical Analysis Community in the world!
Discord: discord.gg
(Mitch Ray's Channel) Amazing community and I highly recommend checking out Mitch Ray if you haven't yet!

chainlink slight pull back for more upward action ?showing a sell signal on. the 4 hour should hit the green aero targets


lINK - BOUT TO MOVEeither way it goes we will likely see a scalping opportunity for 7-17% whether long or short.

CHAINUSDAfter violating the joint in the area 2.00 / 2.25 $ the price reached the 1x2 bullish accelerating towards the 3 dollars. The descent was an opportunity for buyers who see interesting entrance areas on levels 2.50 and 2.30 before going to the previous historical maximum


CHAIN-LINK USD something big is about to happen with chain-link there is a massive bullish divergence i going long and holding on tight

Chain Link Bull pennantChain Link forming bull pennant. Always be careful and set secure your trades with stops

