Chainlink, The Fed, Vanguard, Crypto & Apple"Buy the rumor, sell the fact." The market tends to price-in an event before it happens. I am talking about the reduction in interest rates. The participants are aware that there will be a reduction in interest rates by the Fed and this is bullish and so buying starts to happen much sooner compared to the announcement of the actual event. By the time the event becomes a reality, it is already priced-in. Meaning...
Chainlink is bullish now and the chart is the same as HIVEUSDT, which I shared just now, and many other altcoins. This is good because we know what happens next. If there are other pairs with the same chart but moving up, moving ahead, then we know that these two and all those other staying behind will also follow, makes sense? Sure it does. We are all one. What one does, the rest follows.
Chainlink (LINKUSDT) is set to grow. Easy to see, higher highs and higher lows.
Will the market go up because of the Fed? We can say so before or after the event, right now the only important action is to buy-and-hold. It is important to be fully invested in Crypto, because Crypto is outperforming every other risk-asset in the entire world. You want be in in the market that is about to pay. You don't want to be holding bonds or index funds, that's a huge mistake. You buy these stuff to make money, you can make with Crypto in 6 months what an index fund (Vanguard SPX) will pay in a decade... Do the math, are you a young adult, are you smart? If you are, take action now before it is too late.
Your choice of course. Imagine the people in the 80s investing in Gold rather than Google, Microsoft and Apple... Big mistake.
Namaste.
LINKUSDT.P trade ideas

Chainlink (LINK): Looking For Proper MSB (market structure breakChainlink struggled to break the local 200EMA line, where the price is hovering between the support area at $12.83 and the 200EMA line.
Nevertheless, we are still seeing the demand for breakout so we are expecting to see some sort of buyside movement with proper MSB, which would back our trade idea.
Swallow Academy

"LINK - Time to buy again!"So if you pay attention to the LINK chart you can see that the price has formed a Ascending wedge which means it is expected to price move as equal as the measured price movement.( AB=CD )
NOTE: wait for break of the WEDGE .
Best regards CobraVanguard.💚
Will this breakout unlock 17% gains toward the $16 target?Hello, ✌
All previous targets were nailed ✅! Now, let’s dive into a full analysis of the upcoming price potential for Chain LINK 🔍📈.
BINANCE:LINKUSDT is currently testing the psychological daily resistance zone around the $14.00 level. A confirmed breakout above this area could open the way for a potential upside move of roughly 17%, with the next key target around $16.00. Price action near this zone should be watched closely for either rejection or continuation. 🚀📈
✨ Need a little love!
We put so much love and time into bringing you useful content & your support truly keeps us going. don’t be shy—drop a comment below. We’d love to hear from you! 💛
Big thanks, Mad Whale 🐋

Link Bullmarket?-Overall Bullisch Structure
-VPOC Retest
-Impulse That broke Daily Structure
-WXY that hits the Prime Target followed
by an aggresive Bullmometum that Breaks 4h Structure
-11,50 should told to taget 1)20, 2)26, 3)47
NFA

That's why everyone should have LINK⚡️ Hello, everyone! I decided to continue exploring fundamental altcoins. Next up is LINK. This is definitely a key project in terms of technology, and without it, the crypto ecosystem we know today would not exist. Their oracle technology is used by approximately 90% of ALL protocols.
So it's hard to underestimate its importance, but let's take a look from a technical point of view. How much trading potential does LINK have?
➡️ The token has been in correction for a long time, like practically the entire market. During the decline, it formed a GAP at the level of $25.65 - $20.55. And as we know, 95% of GAPs tend to close sooner or later.
Globally and locally, the token is currently in a flag pattern. Therefore, high volatility and a period of consolidation can be expected in the near future. During this period, the further direction of the token's movement will become clear.
⚙️ Metrics and Indicators:
Volume - a divergence with the price has formed. Throughout the correction, sales volumes have decreased. This signals the exhaustion of sellers.
Money Flow - harmony with the price. Liquidity continues to slowly decline, but at the same time, it does not form new lows, which means that demand for the token remains.
Support/Resistance - LINK has now reached a key level at $12.64, which could trigger a surge in buyer interest. However, if it cannot hold, the next strong support is at $10.09. At the same time, slightly higher, at $15.52, there is strong resistance, which is also a strong psychological resistance (round number).
📌 Conclusion:
LINK certainly still has potential for decline. It is quite undervalued, even with Bitcoin being so expensive. But if Bitcoin falls, LINK will fall even lower, as will the entire market.
And at times like these, everyone's attention turns first to fundamental assets that are truly valuable and currently too cheap. No one is rushing to buy HarryPotterObamaSonicInu10 because no one knows its true value.
🔥 So be patient, LINK is definitely a fundamental asset, and if you want to add it to your portfolio, now is definitely not the time.

Link 26X Next Bull RunChainLink
Chainlink is the platform that connects real-world data, governments, enterprise systems, and thousands of blockchains into unified applications .
It is considered one of the strongest currencies in the market, and will achieve very high numbers in the future. We note that the currency is following an upward trend. Any positive market movement will see this currency rise sharply.
I wish everyone abundant profits.
Like and follow
for more.

LINK/USDT Chainlink Gearing Up for a Major Breakout?
🧠 Overview:
The LINK/USDT chart is showcasing a high-conviction technical setup — a well-defined Descending Triangle that has been forming for over 6 months. This pattern often acts as a pressure-cooker scenario, building up momentum before a major breakout.
The triangle is composed of consistent lower highs pressing against a strong horizontal support zone at $12.5 – $13.2, which has been tested and held multiple times since February 2025.
Currently, the price is approaching the apex of the triangle, signaling that a breakout is likely imminent.
📐 Pattern Details – Descending Triangle:
🔻 Descending Resistance Line: Connecting lower highs since the January 2025 peak.
🟨 Flat Support Zone: The $12.5 – $13.2 level has served as a strong demand zone.
⏳ Apex Nearing: Price action is compressing, and breakout pressure is building.
📉 Decreasing Volume: Volume is drying up — a classic precursor to a breakout move.
✅ Bullish Scenario (Breakout):
If LINK breaks above the descending trendline and reclaims resistance around $14.00 – $15.44, the chart could ignite a strong upside move.
🚀 Bullish Targets:
1. $15.44 (first key resistance & breakout validation)
2. $17.44 (prior structure resistance)
3. $19.38 (swing high from Q1)
4. $26.58 (major resistance zone)
5. $28.00 – $29.35 (long-term upside target)
📌 Breakout Confirmation: Look for high volume and a successful retest of the breakout level to confirm bullish momentum.
❌ Bearish Scenario (Breakdown):
If LINK fails to hold the $12.5 – $13.2 support zone and breaks below it with strong volume, downside risks increase significantly.
⚠️ Bearish Targets:
$11.00 (minor support)
$9.50 (next demand zone)
$8.00 (macro support from 2023)
A breakdown from this triangle would invalidate the bullish setup and could trigger a broader bearish continuation.
🧩 Conclusion & Strategy:
📊 Pattern: Descending Triangle
🕰️ Formation Duration: 6+ months (strong reliability)
🟨 Critical Zone: $12.5 – $13.2 = Key Support
📍 Breakout Trigger: Above $15.4
🔍 Breakdown Trigger: Below $12.5
📌 Trading Ideas:
🔼 Long Position: Upon breakout above $15.4 with confirmation
🔽 Short Position: Upon breakdown below $12.5 with increased volume
📚 Bonus Insight:
Chainlink remains one of the most widely adopted oracle solutions in DeFi and enterprise blockchain. A technical breakout from a long-term consolidation like this could attract both retail and institutional capital.
#LINKUSDT #Chainlink #CryptoBreakout #DescendingTriangle #Altseason #TechnicalAnalysis #BullishSetup #CryptoSignals #TradingView #AltcoinSetups

LINK: Anxiously waiting for a breakout!Chainlink (LINK) Update
Chainlink is currently forming a symmetrical triangle pattern and is shouting for a potential breakout from its resistance. The momentum on LINK has been solid, indicating good potential for continued bullish movement in the days ahead.
However, if LINK breaks down below the support line, the bullish outlook will be invalidated.
As of now, I’m targeting $17 to $20 if a breakout occurs.
Trade safely, and always do your own research and analysis before investing.

LINKChainlink has a target of $62 once it breaks above the resistance line. The Chainlink CEO is very active in the space and continues to add more utility to the project.

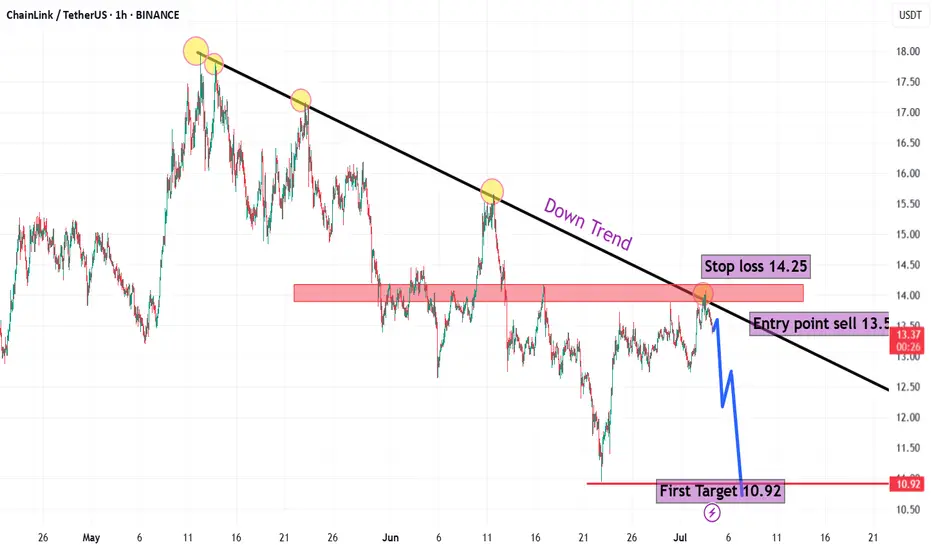
LINK/USD🧠 Technical Overview:
General Trend: The chart shows a clear downtrend starting from mid-May.
Each upward attempt is rejected at the descending trendline, confirming the bearish bias.
🧩 Chart Analysis Elements:
1. Trendline:
Drawn accurately from the major highs, acting as a strong dynamic resistance.
Price has tested this line multiple times and failed to break above it.
2. Supply Zone:
Highlighted in red around the 13.80–14.20 USDT area.
This zone has acted as a strong resistance, causing price to drop again.
3. Entry Point:
Sell at 13.60 USDT, after confirmation of rejection from both the supply zone and the trendline.
4. Stop Loss:
Set at 14.25 USDT, above both the resistance zone and the descending trendline — a logical level to protect the trade.
5. First Target:
10.92 USDT, a clearly identified support level.
This target reflects a likely corrective move within the ongoing downtrend.
📉 Expected Price Action:
Current price is 13.38 USDT, very close to the suggested entry.
If rejection continues from this area, the price is expected to gradually decline toward the 10.92 support level.
The price structure suggests a potential formation of a new lower low.
🔥 Risk-to-Reward Ratio (R:R):
Target: ~2.68 USDT (from 13.60 to 10.92)
Stop Loss: ~0.65 USDT (from 13.60 to 14.25)
R:R = ~4.1:1 → Excellent reward compared to risk.
✅ Conclusion:
The proposed short (sell) trade setup is technically solid and aligns with the broader downtrend.
Classic confirmations: Trendline rejection + Supply Zone resistance + Bearish price action.
Well-placed stop loss and logical support-based target.
Suitable for day traders and swing traders.
LINK Weekly – Double Bottom Confirmed
LINK on the weekly has confirmed a double bottom formation right at the 0.786 Fib level.
Remember, this Fib level is the last major support — so price is basically at bottom levels.
Last week closed above the weekly 200MA.
The next resistance zone is the BB center line and the 50MA.
If price clears this zone, it could push toward the 0.618 Fib level.
Always take profits and manage risk.
Interaction is welcome.

LINKUSDT 1D#LINK has formed a bullish flag on the daily chart.
In case of a breakout above the flag resistance and the daily MA100, the targets are:
🎯 $14.88
🎯 $15.81
🎯 $17.13
🎯 $18.82
⚠️ Always use a tight stop-loss to manage risk and protect your capital.

Chainlink (LINK): Possible Buying OpportunityChainlink has had a smaller bounce since last time, when sellers then took over the area and led the price back to the local support area.
Now price is showing yet again some kind of bullish volume, which might give us another opportunity for upward movement from here.
Swallow Academy

$LINKUSDT EWT Analysis on Weekly chartBINANCE:LINKUSDT EWT Analysis on Weekly chart, On weekly it looks like a 5 wave up and LINK is doing a double correction to retrace the 61.80% level

Link short setup tradeAS previous short setup hits the tp but actually first manipulation to hit the sl, now closely monitor the trade and manually close if 4hr candle closes above the mentioned point, overall I'm bearish on whole market, needs to take a correction before another leg up, until unless usdt.d breaks and closes below 4.59% on 4hrs tf market is bearish, you need to take short position intsead of long positions, when usdt.d reaches 4.63% open short on link, inj, eth and btc and hold till 4.80%-4.89%. I will open long if we break 4.59% and retest this, other scenario if we reaches 4.80-4.90% first no long positions for me from here.

LINK's Situation, A Comprehensive Analysis !!!So if you pay attention to the LINK chart you can see that the price has formed a Ascending wedge which means it is expected to price move as equal as the measured price movement.( AB=CD )
NOTE: wait for break of the WEDGE .
Best regards CobraVanguard.💚
Chainlink (LINK): Possible Reclaim of Bearish CMESellers are showing strong dominance where recently we had broken and secured the 200EMA line and also reached one of our targets on other analysis from last week.
We are now looking and aiming at that bearish CME gap where we might be seeing some sort of sideways movement to form and eventually an MSB with price movement towards the bullish CME—so for now we want to see more downward movement and once we are down, then we get back to Chainlink!
Swallow Academy

LINKUSDTThis is chart ready for pump but wait for break 14$. BINANCE:LINKUSDT
I in below say best supports and resistance's.
Support:
12.66
11.50
10.50
resistance's:
14
16.68
17.70
⚠️Contorl Risk management for trades.

LINk/USDTFor the Link currency, I feel that this decline is continuing and it is continuing to decline step by step. The chart was not readable. Tell me your opinion.

Link targets for august 🔥 BIST:LINK long setup (1 D) 🚀
✅ Entry Zone: $10.50 – $11.80 (18-month demand)
🎯 Targets
• TP-1: $19.50 (Dec-23 supply flip)
• TP-2: $26.00 (Apr-24 breakdown block)
⛔ Stop-Loss
Daily close < $9.40
📊 Thesis
• #CCIP live on 8 L1/L2s; Swift + 10 banks pilot tokenization via CCIP 🏦
• #Staking v0.2 (45 M LINK) secures Data Streams & CCIP 🔒
• Q1-25 product update: Data Streams + Functions → #mainnet for DeFi ⚡
• #Hong Kong CBDC swap & #ANZ stable-coin tests run on CCIP 🌐
• $260 T #untokenized assets addressable; BlackRock tokenized fund cites Chainlink 🏛️
• 55 % circulating LINK locked in staking or DeFi; supply inflation 0 % 🟢

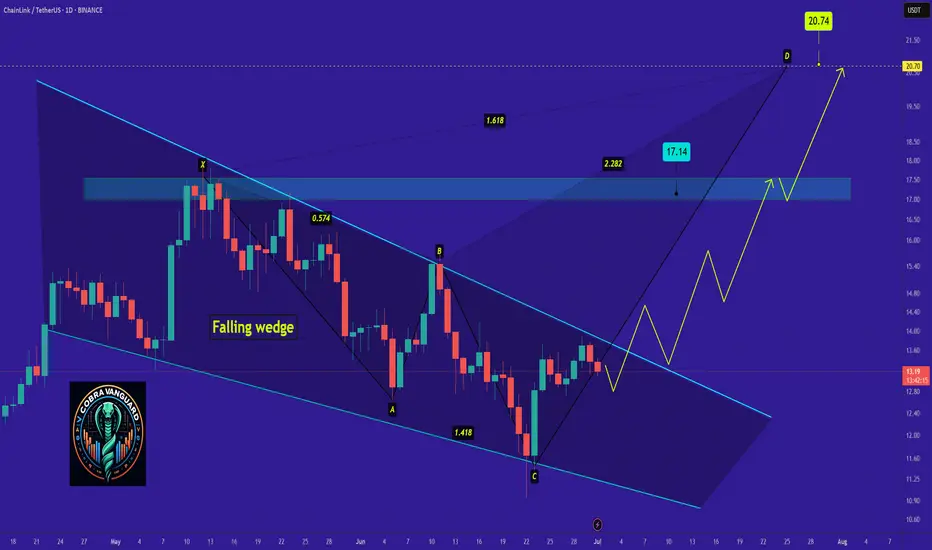
$LINK | Higher Timeframe LONG SetupThe falling wedge pattern visible on the chart has broken to the upside — a historically bullish formation that often signals a reversal. However, it’s important to note that price has not yet reclaimed the EMAs.
📌 The key invalidation level is below the April 7 wick.
As long as there is no candle close below that level, the setup remains valid. A close below would invalidate the wedge structure.
Currently, price is entering a buy block zone, which has previously shown strong demand. A reaction from this region — especially if it pushes price back above the EMAs — would increase confidence in the setup.
🎯 Target zone: 23 – 30 USDT
🛡️ Stop loss: 10.09 USDT
📈 Risk/Reward: High potential
⚠️ This is not financial advice. Always manage your own risk accordingly.
#LINK #Chainlink #LINKUSDT #CryptoTrading #PriceAction #TradingView #Altcoins

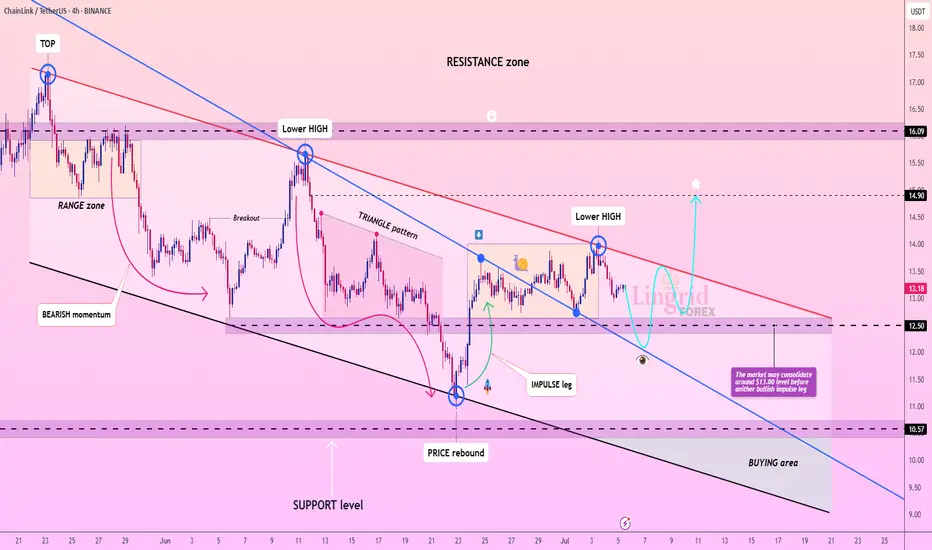
Lingrid | LINKUSDT potential Bullish BreakoutBINANCE:LINKUSDT has formed a sequence of lower highs beneath a descending red trendline, indicating that bearish pressure remains dominant. After a recent rejection near $13.80, price action is now pulling back toward the $12.50–$13.00 range where consolidation is likely. The structure suggests a potential rebound from the lower boundary before another bullish push into the resistance zone near $14.90.
📉 Key Levels
Buy zone: 12.50–13.00 (support + prior consolidation)
Sell trigger: loss of 12.50 support with strong volume
Target: 14.90 – major horizontal resistance
Buy trigger: bullish reversal from the 12.50 support zone
💡 Risks
Breakdown below $12.50 could send price toward $10.57
Lower highs pattern still intact unless $14.00 is cleared
Mid-range chop could delay trend continuation or trap longs
If this idea resonates with you or you have your own opinion, traders, hit the comments. I’m excited to read your thoughts!