Bearish Head and Shoulders Playing Out! We're seeing a classic head and shoulders pattern forming on the 1H timeframe, signaling a potential continuation of the downtrend. The right shoulder is rejecting at key resistance, aligning with the Fibonacci 0.236 - 0.382 zone (19.23 - 19.28), adding confluence to the bearish outlook.
🔎 Indicators Confirm Bearish Momentum:
🔻 RSI Bearish Divergence & Rejection:
RSI is rejecting from the 50-55 zone, a typical resistance level in a downtrend.
No bullish strength yet, confirming potential weakness.
🔻 MACD Bearish Crossover:
The MACD line has crossed below the signal line, suggesting a momentum shift in favor of the bears.
The histogram is turning red, further confirming decreasing buying pressure.
Key Levels to Watch:
🚀 Bullish Breakout: Needs to reclaim 19.52+ for a reversal.
⚠️ Bearish Target: Break below 18.52 (0.5 Fib) opens the door to 17.76 (0.618 Fib) and possibly 16.67 (0.786 Fib).
A breakdown from the neckline could accelerate the move lower. 📉 Watch for volume confirmation!
Would you go short on this setup? Let me know your thoughts! 👇
#Crypto #Trading #HeadAndShoulders #RSI #MACD #TechnicalAnalysis
LINKUSDT.P trade ideas

Chainlink (LINK): Possible Buying Opportunity Near Support ZoneWe expect to see a smaller pullback from current zones after seeing the dominance that sellers are showing.
We want to see price near the support zone, from where we will look for possible upward movement towards the resistance zone.
So as always, let's wait out for the perfect setup here!
Swallow Team

LINK Long Spot OpportunityMarket Context:
LINK has retraced into a major support zone, setting up a potential retest and bounce. Given its historical price behavior at these levels, this provides a strong risk-to-reward opportunity for a long spot position.
Trade Details:
Entry Zone: $14.50 - $16.50
Take Profit Targets:
$19.40 - $21.50
$27.00 - $30.00
Stop Loss: Just below $12.00
This setup aligns with historical support zones and potential continuation of the uptrend. Manage risk accordingly and stick to the plan! 📈🔥

Chainlink (LINK): Possible Bounce From Support?Chainlink seems to have a decent overtake from buyers near the support zone, which could lead price back to $27 zones.
Now we still keep an eye on that support zone, as we might see a sharp selloff, so for additional confirmation, we might wait out for 1 more candle to secure above that support zone before looking for upward movement.
Swallow Tea

LINK Chart Analysis 🚀 #LINK Setting Up for a Massive Move!
📉 Perfect Retest of Key Support Zone
⚡️ Bullish Reversal Formation Incoming
📈 Breakout Above Downtrend = Explosive Move Ahead
🎯 Next Targets:
T1: $27
T2: $32
If you’re not buying LINK at these levels, you’re missing the setup! 🚀🔥
@Whalesdesk

Overnight Scalp SetupLONG setup for LINK with scaled limit orders placed between the highlighted rectangle. AUS based so set and forget overnight with tight stops and take profits pre-determined for a nice scalp.

is LTC feeling cornered?AHAHA, when you go sticking through the walls on a dark day, the same with it, plan for shorts on the black line!
Link with link update Hi
Another idea bearing in. Mind bullish momentum. there a retracement and after that you can go for a nice long
LINK USDT🚀 #LINK Setting Up for a Massive Move!
📉 Perfect Retest of Key Support Zone
⚡️ Bullish Reversal Formation Incoming
📈 Breakout Above Downtrend = Explosive Move Ahead
🎯 Next Targets:
T1: $27.74
T2: $32.59
If you’re not buying LINK at these levels, you’re missing the setup! 🚀🔥

LINKUSDT: Bullish Setup or Breakdown Ahead?Yello, Paradisers! Could this head & shoulders structure spell trouble for LINKUSDT? Or is the market setting up for a bullish reversal?
💎LINKUSDT appears to be showing signs of a retracement due to its head and shoulders pattern. If the price retraces to the identified support zone and presents a bullish I-CHoCH, W-pattern, or inverse head and shoulders on lower timeframes, the probability of a significant bullish move increases.
💎However, if the price drops further to sweep below the current zone (inducement), it’s prudent to wait for confirmation at the strong support zone. Although reaching this level might seem unlikely, if the price does drop, it would strengthen the likelihood of a bullish rebound. In this case, watch for bullish patterns such as I-CHoCH, W-patterns, or inverse head and shoulders to form before taking any action.
💎On the flip side, if a breakdown occurs and the candle closes below the strong support zone, this would invalidate our bullish outlook. In such a scenario, patience will be key—waiting for better price action and clearer market structure before considering the next move.
🎖 As always, the disciplined and patient approach wins in this market. Stick to the plan, follow the confirmations, and trade smart, Paradisers!
MyCryptoParadise
iFeel the success🌴

#LINK/USDT#LINK
The price is moving in a descending channel on the 1-hour frame and is expected to continue upwards
We have a trend to stabilize above the moving average 100 again
We have a descending trend on the RSI indicator that supports the rise by breaking it upwards
We have a support area at the lower limit of the channel at a price of 20.00
Entry price 20.64
First target 21.70
Second target 23.46
Third target 25.20

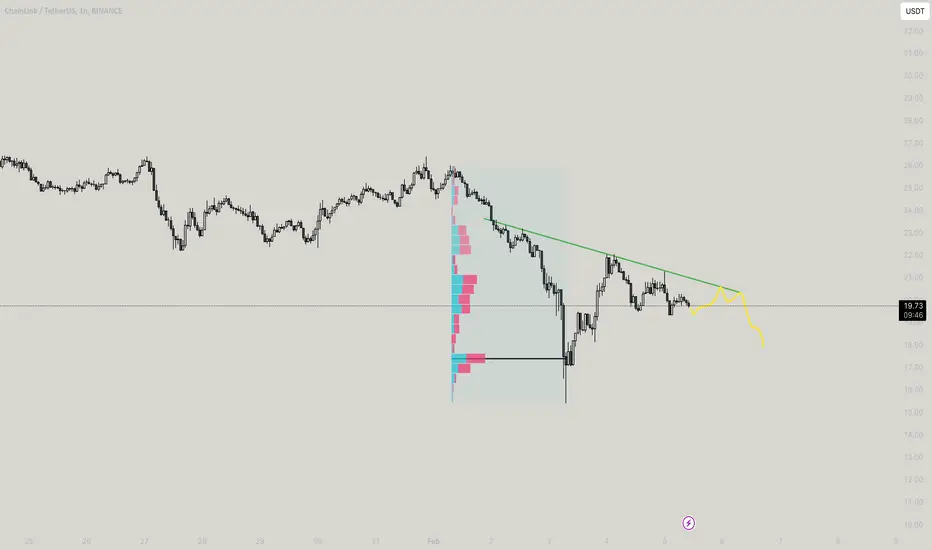
Volume Zones Define LINKUSDT’s Next Move
The BINANCE:LINKUSDT chart shows the price still trading within the channel after a clear liquidity grab. The EMA ribbon remains bullish, indicating potential upward momentum, but critical levels need to be maintained for a sustained trend.
Currently, the 17.92 level serves as a key support within the channel. If the price holds above this level, we could see a potential retest of the upper resistance at 26.45. However, for a confirmed bullish trend, the price must sustain itself above 24.13, which represents the Point of Control (POC) of the channel — the level where the highest volume has been traded, making it a crucial area for validation.
On the downside, if the price breaks below 17.92, it opens the door to lower levels. The next significant volume zones are at 14.62 and 11.42, where price reactions would need to be reassessed for potential accumulation or further downside.
The immediate focus is on how the price reacts to the 17.92 support. A bounce and subsequent break of recent highs could present an attractive long opportunity, while a failure could lead to a shift in the market structure.
👨🏻💻💭 What’s your take on LINK’s next move? Will it hold the channel or dive to lower supports? Share your thoughts and let’s strategize!
__
The information and publications within the 3Commas TradingView account are not meant to be and do not constitute financial, investment, trading, or other types of advice or recommendations supplied or endorsed by 3Commas and any of the parties acting on behalf of 3Commas, including its employees, contractors, ambassadors, etc.


chainlink bearishwe are now in 1 hourly range and I expect to down and touch the level that I mention

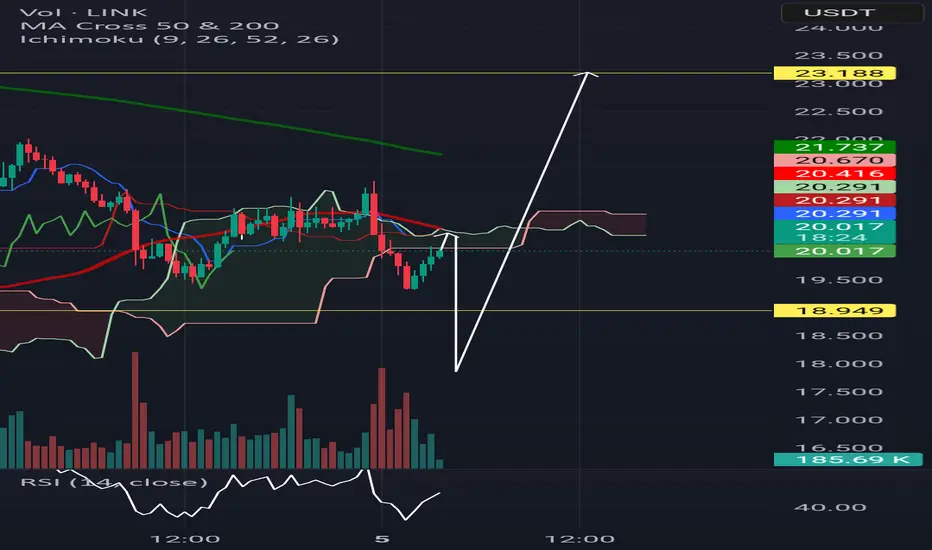
LINK/USDT 1H: Oversold & Accumulating – Ready for a Reversal?LINK/USDT 1H Chart Analysis
🚀 Follow me on TradingView if you respect our charts! 📈
Current Market Structure:
Bearish momentum continues after a recent breakdown.
RSI at 28.70, showing oversold conditions.
Hidden Bullish Divergence forming between RSI and price action.
Smart Money Activity:
Market Makers engineered a liquidity sweep below $20.50.
Accumulation likely occurring at the discount zone.
Premium zone identified between $25.50-$26.00.
Key Levels:
Entry Zone: $20.50 - $20.80 (discount zone).
Targets:
T1: $22.30 (FVG fill).
T2: $23.50 (Equilibrium zone).
Stop Loss: Below $19.80 (to protect downside risk).
Risk Score:
8/10 (High volatility – strong R:R setup).
Market Maker Intent:
Likely accumulating at current levels before the next leg up.
Liquidity grab appears complete, suggesting a potential reversal.
No short entries recommended due to oversold conditions.
Recommendation:
Long positions are favorable within the $20.50 - $20.80 range.
Wait for reversal confirmation before entering.
Monitor volume and price action near $22.30 resistance for breakout strength.
Confidence Level:
7/10 for potential bullish reversal.
🚀 Follow me on TradingView if you respect our charts! 📈

LINK your mind again!!Know how I work? Just follow my old charts and get a stances of how this works!!

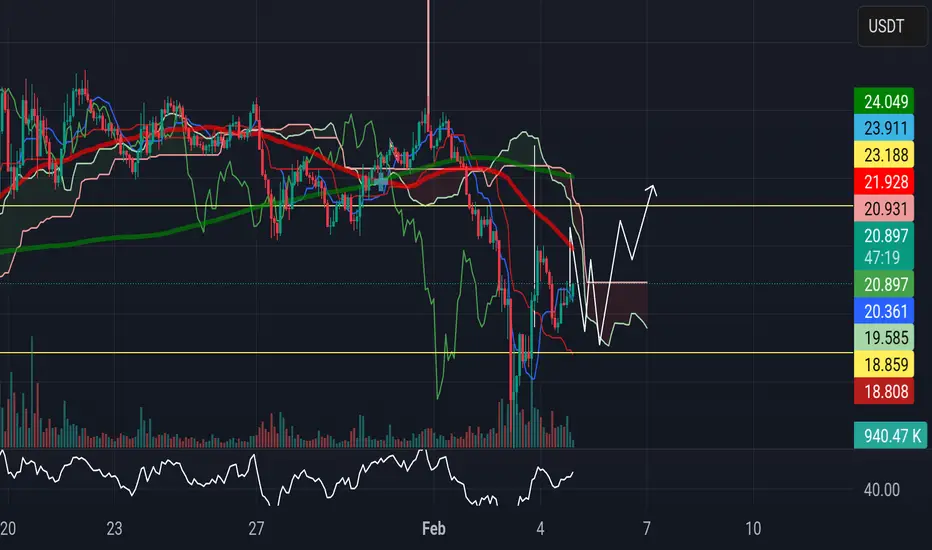
LINK/USDT Analysis – Breakout or Rejection?CRYPTOCAP:LINK is approaching a key descending resistance zone, while the rising trendline continues to provide strong dynamic support (marked with golden boxes).
The price is currently at a decision point—either a breakout or a rejection from resistance.
Please tap the like button to show your support.
Thank you!

LINK upward trend channel |Technical Analysis of LINK/USDT
1. Trend Analysis
Upward Trend Channel:
The price is moving within an ascending channel, indicating a bullish trend.
Support and Resistance:
The lower boundary of the channel (~$22) acts as strong support.
The upper boundary of the channel (~$32-$34) serves as the next resistance.
2. Indicator Analysis
MACD (12,26):
The MACD line is slightly bullish, crossing above the signal line, confirming positive momentum.
Historical movements suggest that bullish crossovers often lead to further upward price movement.
DMI (Directional Movement Index):
The +DI (blue line) is above the -DI (red line), reinforcing the bullish trend.
The ADX line (orange) is near 20, indicating the trend is gaining moderate strength.
RSI (Relative Strength Index):
RSI is at ~59, showing neutral-to-bullish momentum. There is room for the price to rise further before hitting overbought conditions (above 70).
Stochastic RSI:
Currently at ~72, indicating bullish momentum but approaching the overbought zone.
3. Volume Analysis
Volume Oscillator:
Volume shows slight weakness (-20%), suggesting a need for higher volume to confirm a strong breakout above resistance levels.
4. Key Levels
Support:
Immediate: $24 (EMA 9 and channel support).
Strong: $22 (lower channel boundary).
Resistance:
Immediate: $27.8 (current testing zone).
Strong: $32-$34 (upper channel boundary).
5. Conclusion
Bias: Bullish in the short to medium term, provided the price remains within the ascending channel.
Potential Trade Setup:
A breakout above $28 with strong volume could target $32-$34.
A breakdown below $24 might signal a retest of $22 for further accumulation.
Always consider market conditions and set stop-loss levels to manage risk effectively.

Chain link is ready for it’s time to shineIt’s necessary for all cryptos imo. Chart looks fantastic. I think 100-125 is real this cycle. Outside shot of 240-250.

7% PUMP OR DUMP INCOMING FOR CHAINLINKCurrently trading at resistance. we need to flip this $24.75 level into support to then aim for a 7% pump to the upside.
If we reject here, I would expect a 7% dump to the value area low.
#Chainlink #Crypto #Oracle
Calculate Your Risk/Reward so you don't lose more than 1% of your account per trade.
Every day the charts provide new information. You have to adjust or get REKT.
Love it or hate it, hit that thumbs up and share your thoughts below!
This is not financial advice. This is for educational purposes only.

TradeCityPro | LINKUSDT The Time to Buy Has Arrived👋 Welcome to TradeCityPro Channel!
Let’s analyze another cryptocurrency from the market, which is also one of my favorites due to its infrastructure role and its ability to simplify crypto. It seems that a buying opportunity has arrived.
🌐 Overview Bitcoin
Before starting the analysis, as always, let’s take a look at Bitcoin on the 1-hour timeframe, where the futures entry trigger at 104,227 was activated. Currently, it is below the important resistance level of 105,939, which will be the last trigger I provide for futures entry.
If this resistance at 105,939 is broken and Bitcoin dominance is declining at the time of the breakout, switch to altcoins and look for long positions on those that have already made a bullish leg and are trading at relatively higher levels. As long as we are above 104,227, I will continue looking for long triggers.
📊 Weekly Timeframe
On the weekly timeframe, LINK has been one of the cryptocurrencies that remained in a range for 500 days. After breaking out, we have seen the beginning of an uptrend.
This is exactly what I mean by avoiding capital lock-up. We waited weeks for the 8.06 trigger to break, allowing us to buy with momentum confirmation rather than buying inside the range and waiting in a high-risk market.
You might say, "Why not buy inside the range to avoid missing the 8.06 breakout?" My answer is that hundreds of coins are still stuck in similar ranges without showing any bullish moves, and even now, they could trap your capital for a long time, causing frustration!
If you entered at 8.06, continue holding. If you are looking for a re-entry, you can buy after the 29.02 breakout. As for selling, I am not selling yet and will actually try to accumulate more!
📈 Daily Timeframe
On the daily timeframe, LINK is one of the few cryptocurrencies that, after recent corrections, did not return to lower levels. Instead, it bounced off the 0.382 Fibonacci level, increasing the bullish bias.
After breaking 12.96, LINK had a strong rally up to 29.07, where resistance was observed.
Instead of considering 29.07 as resistance, I prefer to buy after a breakout of 26, as this level was previously a pullback zone and had multiple rejections.
Since we have bounced off the 0.382 Fibonacci level, a breakout of the recent high could trigger a new upward move towards the Fibonacci extension targets, which are : 31.24 – 35.10 – 41.44 – 51.19
For buying, I plan to enter a spot position after a 26 breakout with a stop-loss at 15.22, and I will continue holding. I will also look for a futures long position before 26, but for that, I will need momentum confirmation and volume increase!
⏱ 4-Hour Timeframe
On the 4-hour timeframe, a risky long trigger at 24.34 was activated, but there hasn't been much movement yet. A pullback to 24.34 is possible.
📈 Long Position Trigger
the 26.30 trigger is excellent, and I will try to find lower timeframe entries before that. As long as we are above 22.37, my bullish strategy remains intact.
📉 Short Position Trigger
I am not considering any setups unless a clear structure forms. If we see a sharp drop to 22.37 and then break below it, I might consider shorting, but I prefer to focus on more bearish coins instead of LINK.
📝 Final Thoughts
Stay calm, trade wisely, and let's capture the market's best opportunities!
This analysis reflects our opinions and is not financial advice.
Share your thoughts in the comments, and don’t forget to share this analysis with your friends! ❤️

LINK/USDT | 4-Hour Reversal SetupThis LINK/USDT 4-hour chart highlights a potential buy setup at a key demand zone:
Entry: $20.955, anticipating a bounce from the current price action.
Stop-Loss: Placed at $19.766, below the order block (OB) for risk mitigation.
Take-Profit: Targeting the $23.456 level for potential gains.
The highlighted OB zone reflects strong historical support, making this a high-reward trade with manageable risk. Confirmation from volume and candlestick patterns is recommended before entering the trade.
