LINK It has good growth potential in midtermWhat I see now is that the price could correct to the PRZ and then pump again, and currently, there is no specific bullish pattern in the chart. which could cause the price to drop below 13.5 dollars.
Best regards CobraVanguard.💚
LINKUSDT trade ideas

Chainlink Next Move Now Imminent, Strong Setup (8X)I still think that Chainlink has a strong chart setup that can start moving any time without warning.
The rise from 7-April lasted only six weeks and later the retrace lasted 3 weeks. That's 50% of the time. The sixth week that produced the peak was also a red week. When a pair is about to start moving, this is already a strong enough retrace. Three weeks out of a total of eight would be a perfect retrace, both are fibonacci numbers.
The retrace pierced the 0.5 Fib. retracement level and started to recover right above 0.618. The last candle close happened above 0.5. In short, this is perfect bullish price dynamics.
What's more, the short-term 0.618 Fib. retracement level here also marks the breakdown and recovery from July-November 2024. Back then we had a long bottom pattern and this time a short-term one. Another perfect pattern and classic; Elliotts law of alternation.
We have a good one here. I think Chainlink can be a win for us but only time will tell of course.
I thank you for reading.
First leave a comment and then follow.
Thanks a lot for your continued support.
Namaste.

TradeCityPro | LINKUSDT Chart Primed for a Big Move! 👋 Welcome to TradeCityPro Channel!
Let’s dive into analyzing one of the market’s most popular coins, LINK, which continues to hold its key supports in higher timeframes and is poised for strong moves during a market uptrend.
🌐 Overview Bitcoin
Before starting the analysis, I want to remind you again that we moved the Bitcoin analysis section from the analysis section to a separate analysis at your request, so that we can discuss the status of Bitcoin in more detail every day and analyze its charts and dominances together.
This is the general analysis of Bitcoin dominance, which we promised you in the analysis to analyze separately and analyze it for you in longer time frames.
📊 Weekly Timeframe
On the weekly timeframe, LINK has been one of the cryptocurrencies that remained in a range for 500 days. After breaking out, we have seen the beginning of an uptrend.
This is exactly what I mean by avoiding capital lock-up. We waited weeks for the 8.06 trigger to break, allowing us to buy with momentum confirmation rather than buying inside the range and waiting in a high-risk market.
You might say, "Why not buy inside the range to avoid missing the 8.06 breakout?" My answer is that hundreds of coins are still stuck in similar ranges without showing any bullish moves, and even now, they could trap your capital for a long time, causing frustration!
Currently, we can say that after a price rejection at 18.10, we’ve pulled back, and if selling volume increases, we’ll go to test the 9.06 level, but if we form a higher low, we’ve created a good trigger for a buy!
📈 Daily Timeframe
On the daily timeframe, LINK is one of the few cryptocurrencies that, after recent corrections, did not return to lower levels. Instead, it bounced off the 0.382 Fibonacci level, increasing the bullish bias.
After breaking 12.96, LINK had a strong rally up to 29.07, where resistance was observed.
Instead of considering 29.07 as resistance, I prefer to buy after a breakout of 26, as this level was previously a pullback zone and had multiple rejections.
On the daily timeframe, we’ve also been rejected from a strong resistance, which further emphasizes the importance of this daily resistance, and it’s better to say that as long as we’re above the 11.99 support level, the 17.45 resistance will be the best trigger for a spot buy and our entry!
📝 Final Thoughts
Stay calm, trade wisely, and let's capture the market's best opportunities!
This analysis reflects our opinions and is not financial advice.
Share your thoughts in the comments, and don’t forget to share this analysis with your friends! ❤️

Chainlink Bullish Consolidation Is Over —Low Prices Forever Gone1.5 months growing and what? What do you see?
Prices are still relatively low, Chainlink is yet to move.
This is nothing other than great news. The fact that it hasn't move much just yet, means that it will start to move really strong, very very strong in the coming days.
When was the last time you saw a massive bullish wave on this pair?
When was the last time you experienced 300%, 400% or even 600% growth?
This is it. The time is now.
You will see Chainlink growing day after day, week after week, month after month.
It will be something simply awesome.
The chart is saying up. LINKUSDT has been growing and that's it. Several sessions red, several sessions green, but with a bullish bias.
This type of action tends to resolve into a strong bullish jump. It will take time for it to develop, that is, all the action will not happen in a single day, it can take months, but bullish momentum will grow.
Bullish momentum means excitement, lots of people participating in the market, lots of engagement, lots of entertainment, profits and fun.
The time to be in Crypto is now.
Buy like it is the end of the world.
This is the last chance to get bottom prices. We had almost two entire months.
After the action starts, this type of low prices will be forever gone.
Thanks a lot for your continued support.
Namaste.

Link | Long | 1hrThis technical analysis is for informational and educational purposes only. It does not constitute financial advice. Remember to always research and consult with a professional before making investment decisions. Good luck! 📈💼🚀

Important Support and Resistance Areas: 16.72-19.52
Hello, traders.
Please "Follow" to get the latest information quickly.
Have a nice day today.
-------------------------------------
(LINKUSDT 1D chart)
The important support and resistance range is 16.72-19.52.
It is expected that a full-scale uptrend will begin only when it rises above this range.
To do so, we need to see if the price can be maintained above the M-Signal indicator on the 1M chart.
In other words, the key is whether it can receive support and rise around 15.14.
-
If it fails to rise,
1st: 12.49
2nd: 6.70
We need to check whether there is support around the 1st and 2nd ranges above.
-
If it rises above the important support and resistance range, the first resistance range is expected to be around 23.98.
-
Thank you for reading to the end.
I hope you have a successful trade.
--------------------------------------------------
- Here is a description of the big picture.
(3-year bull market, 1-year bear market pattern)
I will explain more details when the bear market starts.
------------------------------------------------------

LinkUSDT will take a few days to get back on trackLinkUSDT will take a few days to get back on track

Link Update (4H) Correction Has StartedIn my previous analysis, I presented two different perspectives on LINK.
On lower timeframes, LINK completed its 5-wave impulsive structure, but in doing so, it invalidated the macro reversed Head and Shoulders pattern—rendering it no longer valid.
Currently, LINK has entered a classic A-B-C corrective phase, signaling temporary market weakness. If the price drops below the key S&R zone (highlighted in pink), I expect a swift move down towards the $13.45 level.
This target coincides with a well-defined demand zone, adding further confluence to the short thesis.
📉 Outlook: Favorable for short positions upon confirmation of breakdown.
— Thanks for reading.

LINK D1 LONG POSITIONyou can open long position and forget it. on D1 demand and has a confirmation on H1

LINKUSDT 1D AnalysisLINK ~ 1D Analysis
#LINK Buy in stages from here with a short term target of at least 10%+ and a long term target of $31

Link Analysis (12H)Chainlink (LINK) Technical Outlook – Elliott Wave Perspective
After applying Elliott Wave Theory, the chart appears to speak for itself — the downward corrective phase seems to have concluded.
Zooming into lower timeframes, there are several bullish signs suggesting that LINK is primed for an upward move.
Key Technical Reasons Supporting Upside Potential:
Bullish Flag Formation: A clear flag pattern has formed in lower time frames, and LINK is currently testing its resistance level.
Elliott Wave Count: Based on wave structure, Wave 3 appears to be nearing completion. Should we see a short-term pullback, it would likely be Wave 4, offering a strong buy opportunity around the support zone of the flag.
Fib Confluence: The potential retracement aligns perfectly with the 50% Fibonacci level — a typical target area for Wave 4 corrections.
Two Possible Scenarios:
Immediate Breakout: With support from Bitcoin’s continued momentum, LINK could extend its current Wave 3 and break out from the flag without any significant pullback.
Healthy Correction: Alternatively, LINK could retrace to the 50% Fib level before initiating the final leg of Wave 5 — providing a textbook buying opportunity.
Target:
In both scenarios, the upside target remains the same: $18.00 to $18.40 range.
— Thanks for reading.

ChainLink - SetupCurrently in a long swing position on CRYPTOCAP:LINK
Tp1 + BE : at $18 — recent highs
Tp2: at $20.5 — trend reversal area
Tp3: at $26.2 — target region
If you have any questions about my system or trade logic, drop them below — I read every comment 👇

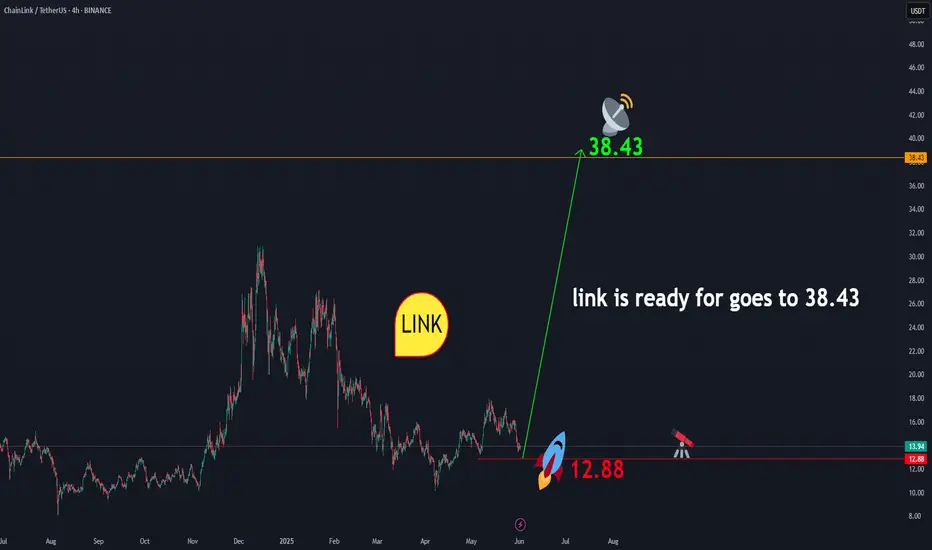
linkusdtLINK is showing readiness to initiate an upward movement towards $38.43. From the current price range of $13.93, a correction down to the $12 area is possible. This zone presents a favorable opportunity for long-term investment . In any case, according to the geometry that has formed in LINK, the price level of $38.43 is expected to be achieved. And this is certain.
BINANCE:LINKUSDT
Buy### Important and main block order ### can cause a return and reaction to the level. ### In the low time frame, wait for the first ceiling to break and trade when hitting the block!!!! ###buy ###choch

Winter Is Coming — And LINK Is Leading the Charge (x25) Chainlink acts as a bridge between blockchain and the real world.
This asset has been on our radar for years, silently building strength. Its fundamentals are rock-solid, and the current price action is highly favorable for a strategic buy.
📈 On November 12, 2023, LINK officially confirmed its journey to $400 by breaking through our algorithmic confirmation zone. Since then, it’s shown a modest price increase… and right now, it's retesting one of the best buy zones we've seen.
But here's the catch:
In the coming weeks, we expect explosive rallies — the kind that won’t allow for optimal entries anymore.
✅ We are currently positioned long on LINK, and it’s proving to be one of our strongest investments to date.
And remember:
The assets we publish on TradingView have already confirmed their trajectory toward our predicted targets.
🎬Not even Trump... not even a world war could stop what’s coming.
🚀 Buckle up... because winter is coming.
And LINK is ready to lead the storm.
🔍 Disclaimer: This is our personal analysis and not financial advice. Always do your own research before making any investment decisions.
💬 What’s your take on this? Drop your thoughts in the comments and feel free to share this with your friends! ❤️

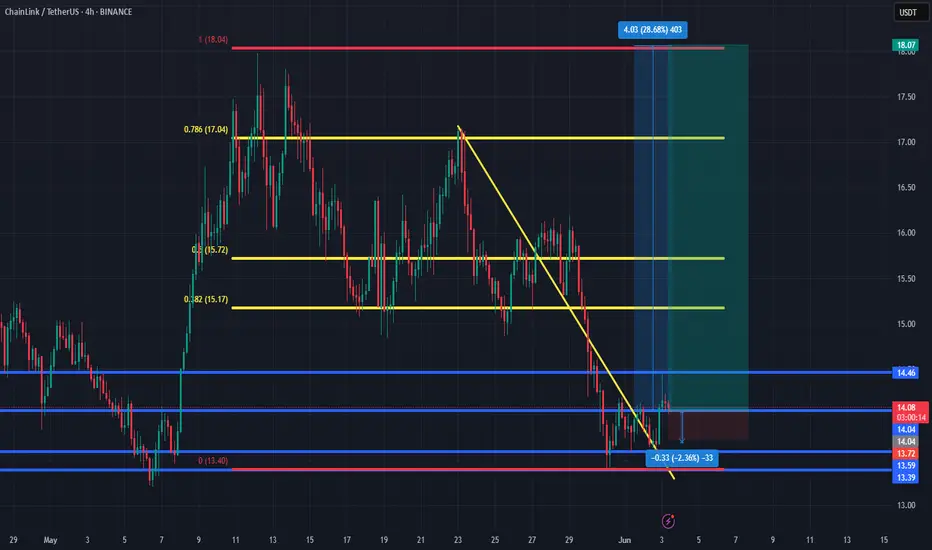
LINK/USDT Long Setup: Technical Bounce + Chainlink FundamentalsTechnical Analysis (LINK/USDT):
The daily chart highlights a strategic entry at 14.019, following a bounce from the 11.90–14.03 support zone, a level with prior consolidation and buying interest. The stop-loss at 11.99 sits below this support, guarding against a breakdown, while the take-profit at 26.51 targets the 24.26–26.54 resistance zone—a previous high with selling pressure—yielding a ~1:5 risk-reward ratio. Recent bullish rejection at support, paired with rising volume, signals potential upward momentum.
Fundamental Analysis (Chainlink/LINK):
Chainlink’s fundamentals are strong in 2025. The expansion of its CCIP protocol has boosted cross-chain interoperability, increasing adoption in DeFi. New partnerships with Polygon and Avalanche have solidified its ecosystem, driving LINK demand. Additionally, the rise in real-world asset tokenization has heightened reliance on Chainlink’s oracles for accurate data, supporting LINK’s value. However, crypto market volatility and regulatory risks remain key concerns.
This trade blends a high-probability technical setup with robust fundamentals, making it a compelling opportunity.

XRP - Time to buy again!The pattern has broken, and now I expect the price to rise to $20 . AB=CD.
Give me some energy !!
✨We spend hours finding potential opportunities and writing useful ideas, we would be happy if you support us.
Best regards CobraVanguard.💚
_ _ _ _ __ _ _ _ _ _ _ _ _ _ _ _ _ _ _ _ _ _ _ _ _ _ _ _ _ _ _ _
✅Thank you, and for more ideas, hit ❤️Like❤️ and 🌟Follow🌟!
⚠️Things can change...
The markets are always changing and even with all these signals, the market changes tend to be strong and fast!!

Chainlink Buys to continue uptrend 🔍 1. Technical Analysis
Uptrend Continuation Indicators:
Higher highs and higher lows on the daily or 4H chart.
Key resistance levels: Watch if LINK breaks and holds above resistance (e.g., $18–$20 zone).
Moving averages: Trading above the 50-day and 200-day moving averages can support bullish momentum.
RSI/MACD: RSI between 50–70 and a MACD crossover can support continued momentum without overextension.
📈 2. Fundamental Catalysts
Partnership announcements or oracle integrations with top blockchains (like Ethereum L2s).
Staking growth: More LINK being staked (especially in Chainlink Staking v0.2) = reduced supply, potentially boosting price.
Adoption trends: More protocols relying on Chainlink oracles means higher demand.
Link, 1DAs BTC is Falling And BTC is given Breakout of Pattern in 4Hr , then Remaining coins will also fall drastically .
in 1D pattern of ADA USDT , it is Breaking Down as BTC is also given Break Down of Pattern
Follow for More Ideas like This


LINK 1H LINK possible path has been drawn
a bit set back and then going even higher is possible
BINANCE:LINKUSDT
𓄀𝓈𝓉𝒶𝓎 𝓉𝓊𝓃ℯ𝒹 𓃓

Chainlink Price forcasting on 27/May/2025Chainlink Price forecasting on 27/May/2025 . My goal is 18$. I think it will reach in the next 10 hours. So keep watching.

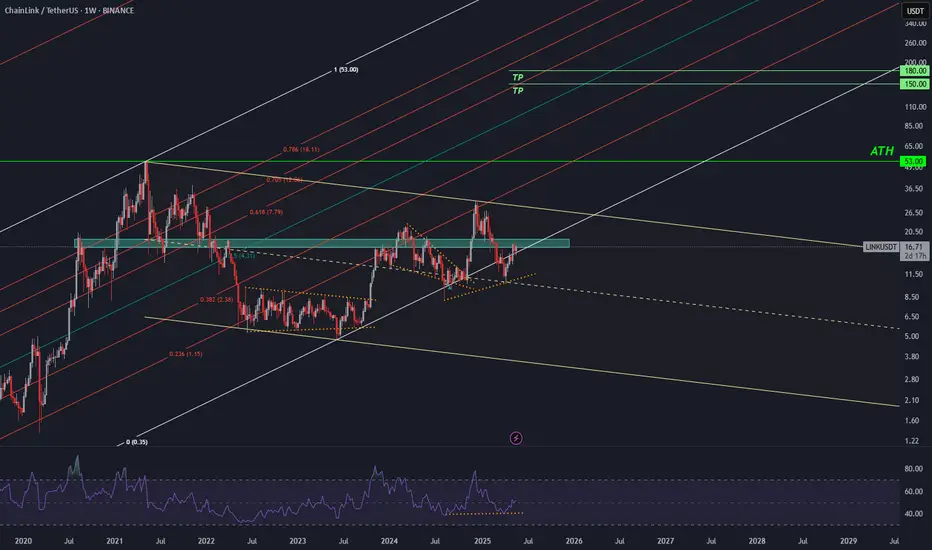
LINKUSDT / WEEKLY TPThe price, after a fake breakout at the end of the long-term channel, has returned inside the channel. If the descending channel is broken, the price will move toward its all-time high (ATH).Considering the possibility of a bull run in the second half of 2025, the price could easily reach $150 and $180 during the altseason rally.
This is just my personal opinion!!!!!!!!!!
Always use a stop-loss