LINK - The sleeping Giant ready to wake!Don't forget to add LINK to your watchlist — it's a solid project with long-term investment potential.
The weekly chart shows that LINK is currently retesting the downtrend line it recently broke — a textbook bullish retest.
The lower trendline now acts as a key support level, and as long as price holds above it, the structure remains healthy.
Currently trading around $17.6, the price hasn’t moved significantly yet —
You’ve got:
✅ A strong fundamental project
✅ A bullish technical setup
✅ Large market cap
✅ Still early entry
What more do you need to enter?
Accumulate now... and thank me later.
Best Regards:
Ceciliones🎯
LINKUSDT trade ideas

Chainlink (LINK): Potential Bounce Incoming | Eyes on Neckline!Chainlink is in an accumulation zone currently bouncing from that neckline zone (which has aligned with 100 EMA).
We are looking for proper bounce or buyside signs here, which would give us a good opportunity for a potential buy entry here
Swallow Academy

LINK Swing Trade – Watching for a PullbackLINK has rallied 58% since June 24th and is now consolidating after making a higher high. Price action is facing resistance and looks overheated, so a pullback toward support could offer a fresh long entry.
📌 Trade Plan:
• Entry Zone: $15.00 – $16.00 (on pullback)
• Take Profit Levels:
o 🥇 $20
o 🥈 $25
o 🥉 $30
• Stop Loss: Close below $13

LINK your Idea! Its time!Buying at the right time is the best thing you can do and selling at the right time too! aint it?
Link pump today at least $18.78Am taking this #Link long. Anticipate tp to hit today if goes according to plan.
Weekly bullish
Daily bullish
4hr bearish
1hr bullish
I think the market will soon attempt to flip back bullish on the 4hr tf. Market is making...(Further breakdown on my X page with more charts)

Link / UsdtBINANCE:LINKUSDT
### 📊 **Chart Overview – LINKUSDT (4H):**
* **Current Price:** \$17.65
* **Recent Trend:** Pullback from the \$20.00 resistance zone.
* **Key Support Zones:**
* Immediate: **\$17.00 – \$17.20** (gray demand zone).
* Stronger: **\$14.00 – \$14.20**.
* **Resistance:** \$20.00 psychological level.
---
### 🔍 **Technical Breakdown:**
1. **Trendline Interaction:**
* Price is testing the **ascending red trendline**, which could act as dynamic support.
* A break below could push LINK toward **\$17.18 or even \$14.16** for a deeper correction.
2. **Bullish Scenario:**
* If the \$17.00 zone holds, LINK could bounce and aim for **\$18.50 – \$19.80** in the short term.
3. **Bearish Scenario:**
* A decisive break below \$17.00 may trigger a larger move down to the **\$14.00 support zone**, offering better accumulation levels.
---
### 📌 **Summary:**
LINK is at a **critical decision point** — watch the \$17.00 support zone and the trendline closely for direction confirmation.
---
⚠️ **Disclaimer:**
*This analysis is for informational and educational purposes only. It is not financial advice. Always DYOR and manage your risk before trading.*

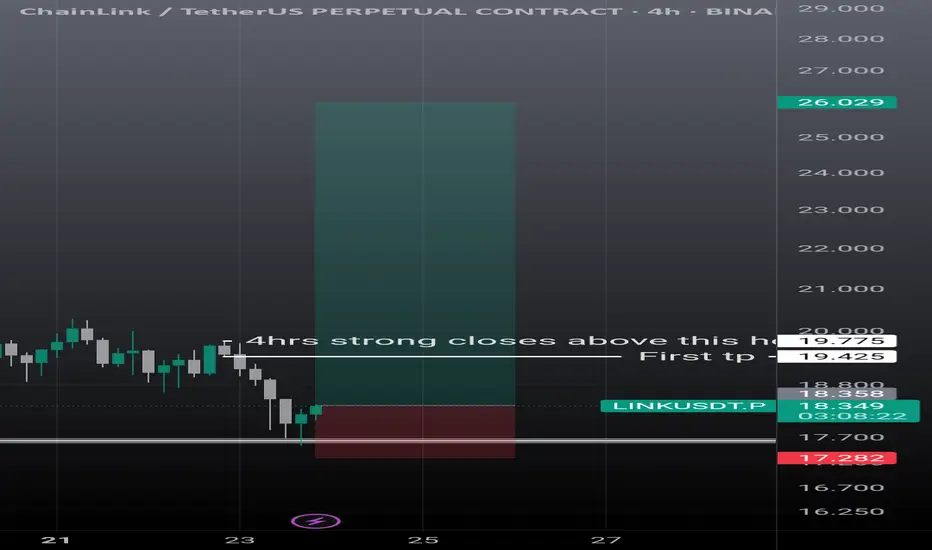
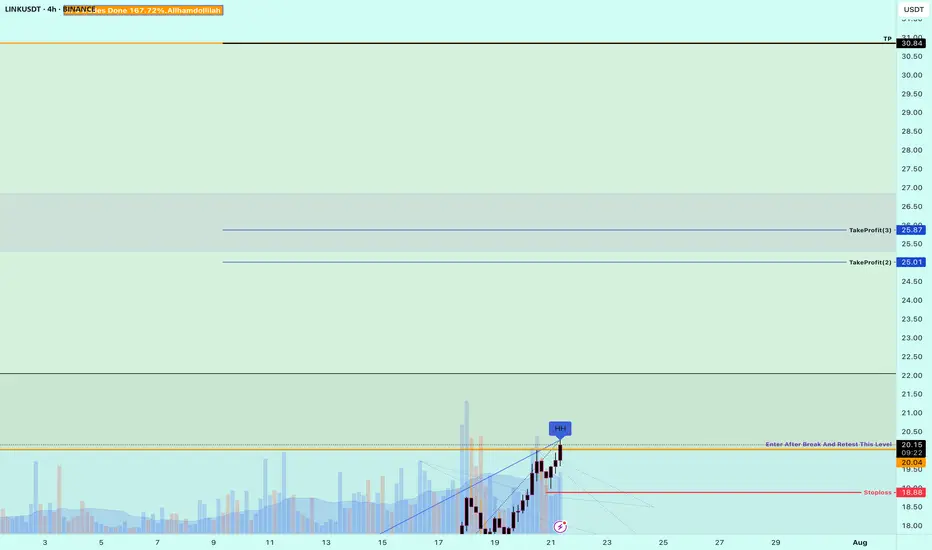
Linkusdt scalp n swing setupLink showing some strong momentum. On 4hrs it can go easily 19.30, then if it breaks strong and closes above the mentioned candle it's next stop is 26$. Must use sl as it can take further correction is it failed to break the mentioned level.
Smart Robbery Plan: LINK/USDT Long Setup | Swing/Day Trade Idea🚨CHAINLINK HEIST PLAN 🚨 | LINK/USDT Market Robbery (Thief Trader Style) 💰🔐
🌍 Hola! Bonjour! Hallo! Marhaba! What’s up, Money Makers & Market Robbers?! 🕶️💵
Get ready to raid the LINK/USDT vault with Thief Trader’s high-precision strategy based on 🔥 Technical & Fundamental fusion 🔥.
This is not your regular setup. This is a robbery roadmap. Designed for swing & day traders, and spiced with smart DCA entries, risk control, and a bold vision. Let's get into the game plan before the market alarms go off! 🚓📉📈
🎯 Master Plan – LINK/USDT | Bullish Setup
Entry:
📌 “The vault is open – grab the loot!”
Start entering long anywhere within the nearest price pullback zone. Use 15m to 30m TFs for sniper-style limit entries.
🛠️ Deploy DCA-style multiple limit orders (layered strategy), preferably around recent swing lows or major liquidity zones.
Stop Loss:
🔐 Place SL just below the 4H swing low wick (Currently at $16.50), adjusting for your risk, lot size, and how many limit orders you're stacking.
Take Profit:
🎯 Main TP target: $21.50
⛔ Or bail early if momentum weakens. Your profit, your decision.
⚡️Scalper’s Memo:
Only scalp on the bullish side – stay with the smart money.
Have deep pockets? Jump in now.
On a budget? Join swing traders and follow the full heist plan.
📉 Use trailing SL to secure profits during volatile rallies.
🔍 Fundamental & Sentiment Snapshot:
LINK is gaining bullish traction due to a combo of strong sentiment, favorable macro outlook, and on-chain flows aligning.
📊 Keep eyes on COT reports, intermarket data, and liquidity metrics.
🧠 Sentiment leans bullish while late bears are trapped in the supply zones above.
🛑 Risk & News Management Alert:
🚨 News releases can spike volatility and mess with clean entries.
📵 Avoid placing trades during high-impact events.
📍 Use trailing stop-loss to protect your running profits and preserve capital.
💖Support the Plan, Join the Heist:
Love the trade idea? 💥Hit the BOOST💥 button and show some love to the strategy that lets traders "rob the market" with confidence.
Every like helps build the strongest heist crew on TradingView.
✅ Stay sharp. Stay patient. Stay profitable.
👤 Thief Trader signing out… until the next raid. 🐱👤💰🚀
#LINK #LINKUSDT #CryptoTrading #ThiefTrader #SwingTrade #DayTrade #DCA #BullishSetup #TradingPlan #TA #RobTheMarket #ChainlinkHeist #SmartMoneyMoves

link buy midterm"🌟 Welcome to Golden Candle! 🌟
We're a team of 📈 passionate traders 📉 who love sharing our 🔍 technical analysis insights 🔎 with the TradingView community. 🌎
Our goal is to provide 💡 valuable perspectives 💡 on market trends and patterns, but 🚫 please note that our analyses are not intended as buy or sell recommendations. 🚫
Instead, they reflect our own 💭 personal attitudes and thoughts. 💭
Follow along and 📚 learn 📚 from our analyses! 📊💡"

LINK to 30$ or more?Hi Padawans,
Hope you’re doing well.
I’m anticipating some good short scalp opportunities around the levels marked in the chart.
Do your own research padawans.
Best regards,
Crypto Obi

LINK/USDT, 1H chart, Futures - Bullish projection.based on 1H chart, we have a confirmed bullish divergence, this divergence is supported by potential bullish divergence in formation for 4 chart
H, so it could boost the movement with much more upward probabilities.

LINK's Technical Signals Point to a 50% Rally by Years-EndLINK is trading at approximately $19.26. The price has shown significant volatility and upward momentum over the past few months, moving from around $10-11 in early 2025 to the current levels near $19, representing an impressive 80-90% increase.
Technical Indicator Analysis
RSI (Relative Strength Index)
The daily RSI is currently at 61.60, which is in bullish territory but not yet overbought
The 4-hour RSI is showing similar strength at 61.60
This indicates robust momentum without reaching extreme levels that would trigger immediate profit-taking
Historical data shows LINK can sustain RSI readings in the 60-70 range during strong uptrends
Price Action Patterns
LINK has formed a series of higher highs and higher lows since May 2025
The price recently consolidated in the $17-19 range before showing signs of continuation
There was a significant price surge from $13-14 levels to above $19 in mid-July, indicating strong buying pressure
The consolidation after rapid gains suggests healthy market behaviour rather than exhaustion
Volume Analysis
Volume has been increasing during upward price movements
Notable volume spikes occurred during the breakout from $15 to $17 and again during the move above $19
This suggests genuine buying interest rather than a low-volume pump
The Volume-Weighted Average Price (VWAP) continues to slope upward, confirming the strength of the trend
Support and Resistance Levels
Strong support has formed around $17.50-18.00
Previous resistance around $19.00 is now being tested as support
The next major resistance appears to be in the $20-21 range based on previous price action
After that, there's relatively little historical resistance until the $25 level
Fibonacci Projections
Using the recent swing low of approximately $11.45 (May 2025) to the recent high of $19.66:
The 161.8% extension projects a target of approximately $24.70
The 200% extension suggests a move toward $28.00
These Fibonacci levels often serve as magnets for price during strong trend movements
LINK Price Projection
Based on the technical indicators analysed:
Short-term (August-September 2025):
LINK appears poised to break through the $20 psychological barrier
Initial target around $22-23 as the next resistance level
Support should hold around $17.50-18.00 on any pullbacks
The clean break above previous resistance at $18.50-19.00 suggests momentum remains strong
Medium-term (October-November 2025):
If the current trend structure remains intact
LINK could target the $24-25 range, aligning with the 161.8% Fibonacci extension
Previous all-time highs near $30 could come into play by year-end
The steady stair-stepping pattern of rallies followed by consolidation suggests this move would be sustainable
Key Factors to Watch:
Volume on breakouts above $20 and $25
RSI readings for signs of exhaustion or continued strength
Development updates and adoption news specific to Chain-link
Maintenance of the higher lows pattern on any pullbacks
Conclusion
The technical picture for LINK appears bullish, with multiple indicators suggesting continued upward momentum. The price has established a strong uptrend with healthy consolidation periods. The recent price action shows accumulation rather than distribution, with higher lows forming during consolidation phases.
The most likely scenario based on current data suggests LINK could reach the $24-25 range in the next 2-3 months, with potential for movement toward $28-30 by the end of 2025, representing a 30-55% increase from current levels. However, investors should monitor key support levels around $17.50-18.00 for any signs of trend reversal.
The clean chart structure, steady volume profile, and measured RSI readings all point to a continuation of the current uptrend, making LINK's technical outlook decidedly positive for the remainder of 2025.
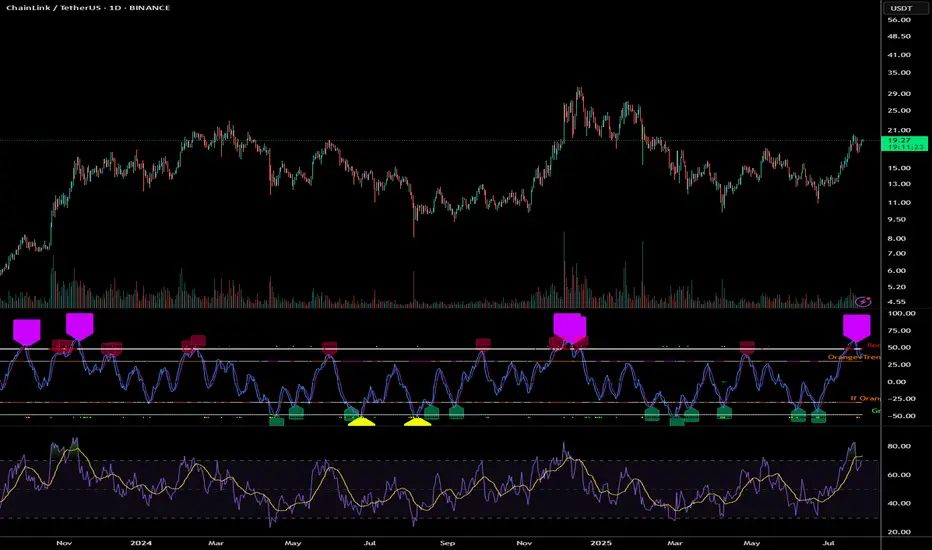
Chainlink (LINK) Trapped Between $18–$20: Explosion Soon?Chainlink (LINK) has been in a strong uptrend for most of July, rallying from under $13 to a recent high of $20.28. This level acted as a clear resistance where a "Sell" signal has been triggered, suggesting a temporary exhaustion of bullish momentum. After this peak, price has pulled back slightly and is now trading near $19.08, hovering between key levels — with $20.28 acting as resistance and $17.98 as nearby support. This positioning confirms that LINK is currently rangebound and consolidating.
Structurally, the price made a series of higher highs and higher lows, with a steep bullish leg between July 14 and July 21. However, recent candles show signs of hesitation. There's less conviction in the current move, indicating that traders are likely waiting for either a breakout above resistance or a breakdown below support to commit to the next move.
The range between $17.98 and $20.28 is now the battlefield. A clean break above $20.28 would signal bullish continuation, with the next logical upside target being around $22 or higher. But if price fails to hold $17.98, it may retrace deeper — first toward $15.66 (the breakout base), and then possibly down to $14.08 or $13.39 where previous accumulation occurred.
Volume appears to have faded slightly during the recent leg up, which adds weight to the idea that LINK needs a consolidation phase before resuming any meaningful trend. There's also a previous "Buy" signal near $15.66 that aligns with the last breakout zone, making this a key level to watch if bears regain short-term control.
Right now, it's a no-trade zone unless the market shows clear direction. Traders with a neutral stance should wait for confirmation — either a strong breakout above $20.28 with a decisive candle and follow-through, or a breakdown below $17.98 which opens up downside opportunity. Until then, LINK is best treated as being in a mid-cycle pause, building up energy for its next major move.

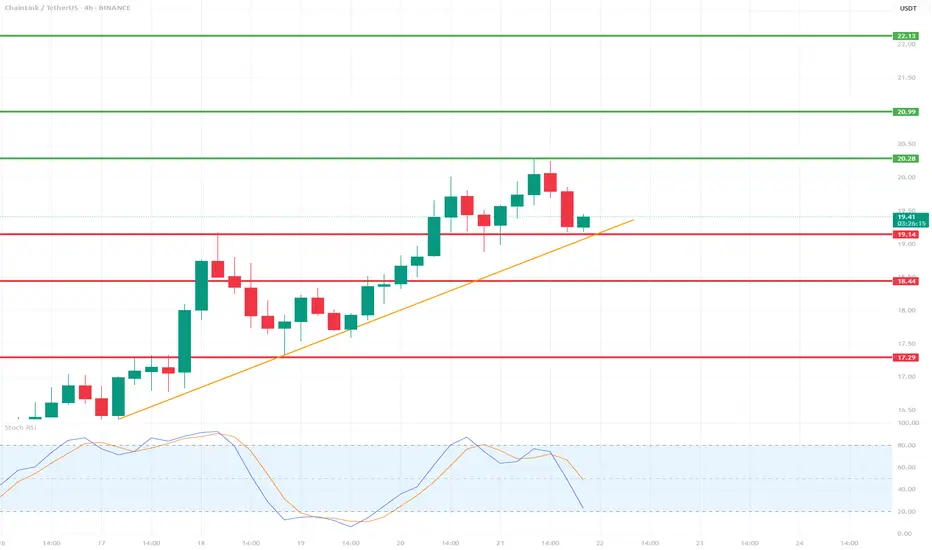
LINK/USDT 4H Chart📉 Indicators and Market Structure:
🔶 Trend:
Current trend: up, as long as it remains above the trend line and the 19.14 USDT level.
Local resistance: 20.28 USDT (recent high).
Next resistances: 20.99 USDT and 22.13 USDT (green lines).
Supports: 19.14 USDT, 18.44 USDT, 17.29 USDT (red lines).
🔷 Stochastic RSI (lower indicator):
Located in the oversold zone (below 20) and starting to reverse upward.
Potential signal of buying pressure if the %K and %D lines cross bullishly.
🧠 Scenarios:
✅ Bullish scenario (trend continuation):
Bounce from the trend line and the 19.14 level → breakout of 20.28 → test of 20.99–22.13.
Confirmation will be a clear bullish candle with high volume and a Stochastic RSI cross up.
❌ Bearish scenario (trend break):
Closing below the trend line and the 19.14 level → correction towards 18.44, and then even to 17.29.
An oversold RSI could support continued declines if a rebound does not occur.
📌 Summary:
Currently, the key level is the trend line and support at 19.14 USDT.
The market is waiting for a reaction – a rebound or a downward breakout.
Stochastic RSI suggests a possible rebound, but candlestick confirmation is needed.
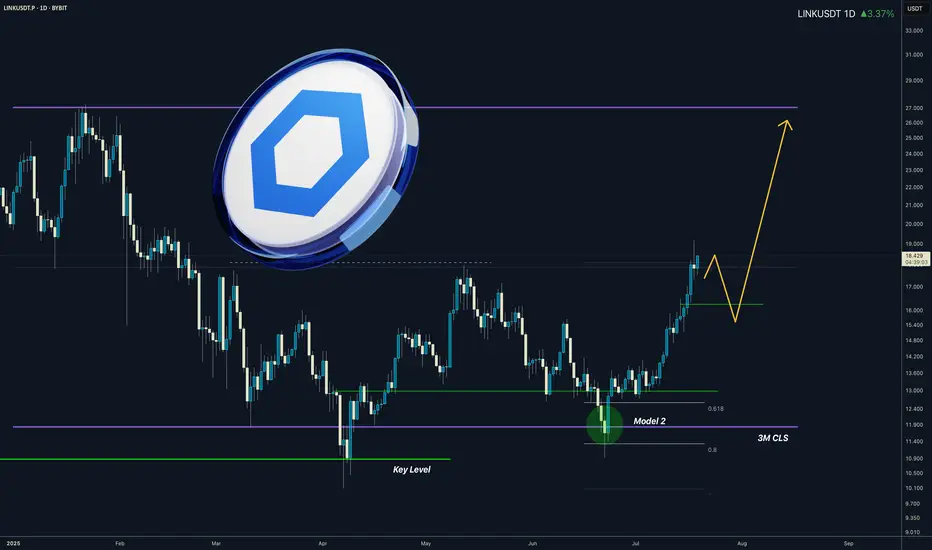
LINK I 3M CLS I Model 2 In the Motion I Target Full CLS rangeYo Market Warriors ⚔️
Fresh Crypto Analysis— if you’ve been riding with me, you already know:
🎯My system is 100% mechanical. No emotions. No trend lines. No subjective guessing. Working all timeframes. Just precision, structure, and sniper entries.
🧠 What’s CLS?
It’s the real smart money. The invisible hand behind $7T/day — banks, algos, central players.
📍Model 1:
HTF bias based on the daily and weekly candles closes,
Wait for CLS candle to be created and manipulated. Switch to correct LTF and spot CIOD. Enter and target 50% of the CLS candle.
For high probability include Dealing Ranges, Weekly Profiles and CLS Timing.
Analysis done on the Tradenation Charts
Disclosure: I am part of Trade Nation's Influencer program and receive a monthly fee for using their TradingView charts in my analysis.
Trading is like a sport. If you consistently practice you can learn it.
“Adapt what is useful. Reject whats useless and add whats is specifically yours.”
David Perk aka Dave FX Hunter
💬 Comment any Coin I ll give you my quick view
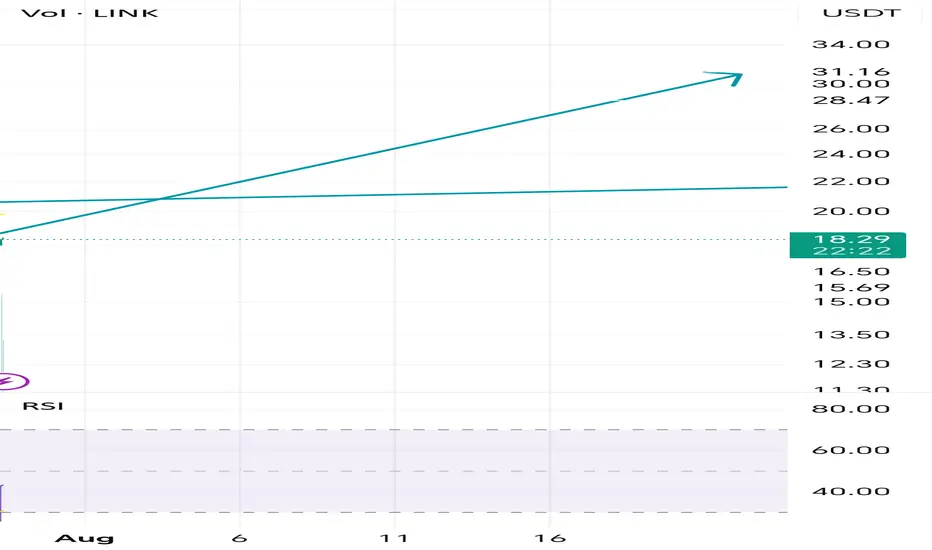
Link targeting 30$In my view after a deeper retracement to 0.618 fibonacci level , about 16.3$, Link bullish trend will resume to target 30.4$

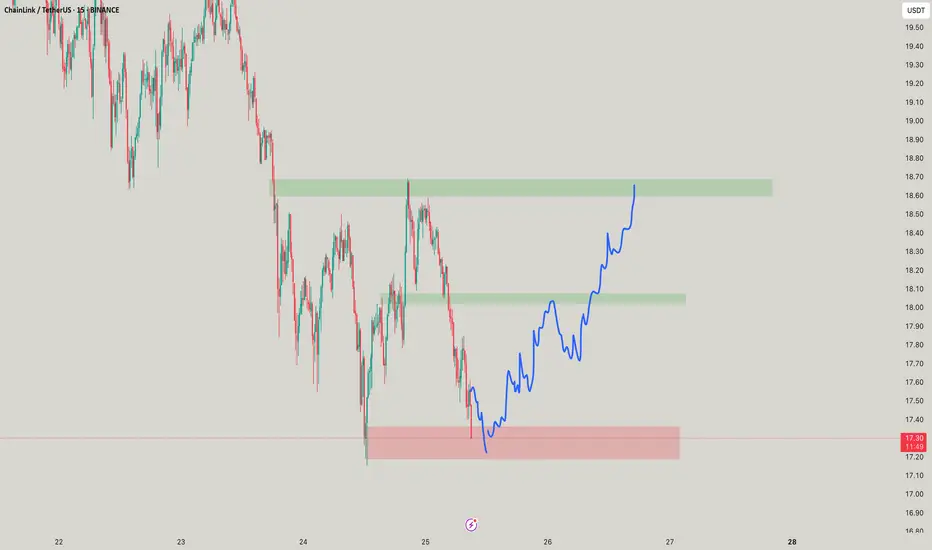
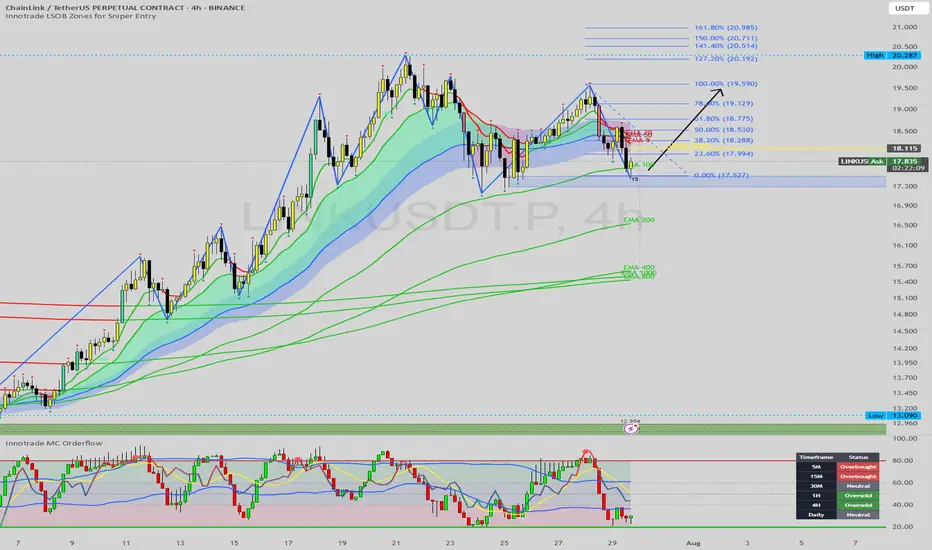
LINK at a Crossroads: A High-Confluence Setup at Key SupportToday we're analyzing Chainlink (LINK), which is currently testing a critical support level after a sharp pullback from the $20.28 highs. The price is now situated at a technical crossroads that will likely determine its next major directional move.
This analysis will detail the powerful confluence of technical factors that make the current zone a high-probability area for a bullish reversal. This is an educational breakdown of how to stack multiple signals to identify a strong "buy the dip" opportunity within a larger uptrend.
The Analysis: A Convergence of Bullish Factors
The most reliable trade setups occur when several independent indicators all point to the same conclusion. On this 4-hour chart for LINK, we have a textbook example of such a convergence.
1. The Overarching Bullish Structure:
First, let's look at the big picture. The Zig-Zag indicator shows a clear and healthy uptrend, defined by a series of higher highs and higher lows. This establishes our primary bias. The current downward move is corrective, not a trend reversal, meaning our focus should be on finding logical entry points to rejoin the dominant trend.
2. The Critical Support Cluster:
LINK is currently testing a powerful floor of support between $17.30 and $17.80. This is not just one level, but a cluster of three key support elements:
Prior Swing Low: The price is testing a key structural low, a natural point where buyers are expected to show interest.
Demand Zone / Order Block: A significant demand zone (the blue-shaded area) is located here, representing an area of prior institutional buying interest.
The EMA 100: Providing a strong layer of dynamic support, the EMA 100 is flowing directly into this structural and order block zone. The confluence of these three factors creates a formidable support area.
3. The Momentum Exhaustion Signal:
This provides the crucial timing for our setup. While the price has been dropping, our momentum dashboard shows that sellers are running out of steam precisely as price hits this key support cluster.
The 1H and 4H timeframes are both registering as "Oversold." This indicates that on the timeframes most relevant to our chart, selling pressure is exhausted. It's a classic sign that the corrective move is overextended and a reversal is likely.
The Potential Trade Plan
Based on this strong alignment of structure, support, and momentum, here is a potential trade plan:
Entry Zone: The current support cluster between $17.30 and $17.80 is the ideal zone to watch for bullish price action and potential entries.
Stop Loss: A logical stop loss can be placed just below the recent swing low and the demand zone, around $17.10. A break below this level would invalidate the immediate bullish thesis.
Potential Targets:
Target 1: A reclaim of the Daily Open at $18.11.
Target 2: A test of the overhead resistance and the descending short-term MAs in the $18.80 - $19.20 area.
Target 3: A full retest of the major swing high at $20.28.
Conclusion
We have a powerful confluence of bullish factors: the price is respecting a primary uptrend structure, it has entered a key support cluster (swing low + demand zone + EMA 100), and multi-timeframe momentum is signaling that sellers are exhausted. This presents a compelling, high-probability setup for a long position on Chainlink.
Disclaimer:
This analysis is for educational purposes only and does not constitute financial or investment advice. Trading involves a high level of risk. Always conduct your own thorough research and consult with a licensed financial advisor before making any trading decisions.
LinkOn the higher TF Link is breaking out from its structure, my first target is 21.5
2nd target 28
3rd 30
Good luck
MY idea
Chainlink (LINK): Looking For Target of 200EMA (Daily)Chainlink has done very well, and we have also opened one long position near the breakout area at $14. Now we are looking for the price to have a proper retest after what we expect to see some downward movement so eyes on the daily 200EMA line for now!
Swallow Academy

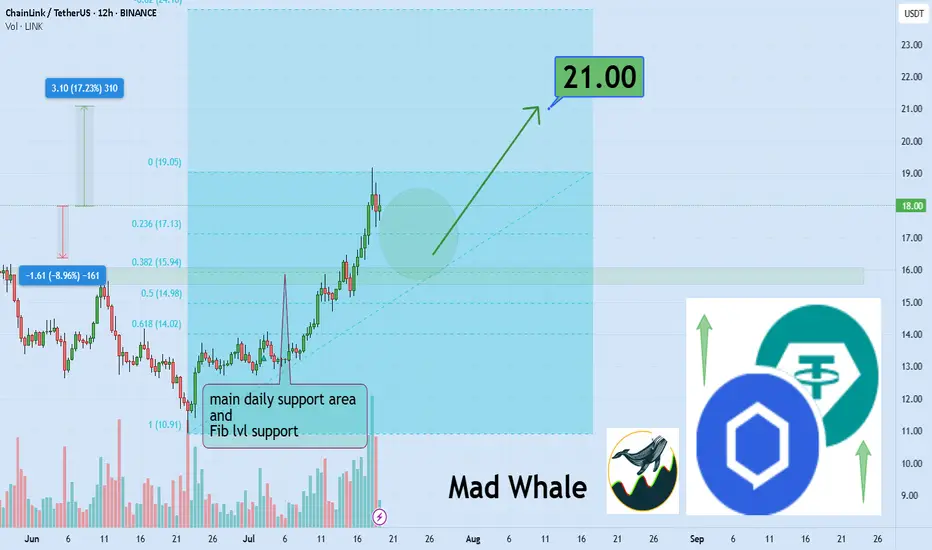
Chainlink Breaks Channel, Eyes 17% Upside Toward $21 TargetHello✌
Let’s analyze Chainlink’s upcoming price potential 📈.
BINANCE:LINKUSDT has broken out of its daily descending channel, printed a multi-month high, and is now pulling back toward daily and Fibonacci support levels; I'm eyeing a 17% potential move higher with $21 as the main target. 🔍📊
✨We put love into every post!
Your support inspires us 💛 Drop a comment we’d love to hear from you! Thanks , Mad Whale
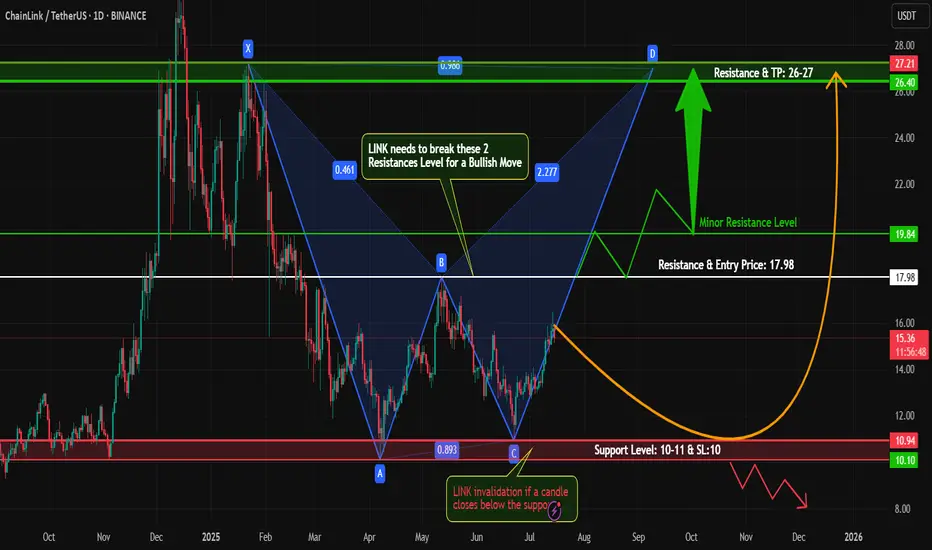
#LINKUSDT – Bullish Harmonic Pattern in Play!Hey Traders!
#LINK is currently trading near the bottom and forming a potential harmonic pattern, suggesting a possible move towards the D-point completion.
Technical Outlook:
Price action is respecting the harmonic structure.
We're watching closely for a break above key minor and major resistance levels.
A successful breakout and retest could confirm a bullish reversal.
Entry on retest with tight risk management and SL as marked on the chart.
Caution: Stay alert for fake breakouts, bearish divergence, or any signs of rejection near resistance. Patience is key — wait for confirmation!
What are your thoughts on #LINK? Are you bullish or bearish? Drop your analysis below!
If you found this setup helpful, like, comment, and follow for more high-probability trading setups every week!
#Crypto #LINK #HarmonicPattern #Altcoins #ChartAnalysis #CryptoTrading #TradingView #BullishSetup #BreakoutTrade #RiskManagement
Buy Trade Strategy for LINK: Powering Smart Contracts with RealDescription:
This trading idea is centered on LINK, the native token of the Chainlink network—one of the most crucial infrastructures in the blockchain ecosystem. LINK fuels decentralized oracles that connect smart contracts with real-world data, enabling everything from DeFi platforms to insurance protocols and gaming applications. With countless integrations across blockchains and institutional partnerships, Chainlink has positioned itself as a foundational layer for Web3 development. The growing need for reliable, tamper-proof data feeds strengthens the long-term fundamentals of LINK.
That said, the crypto market remains highly speculative and volatile. The price and adoption of LINK can be significantly impacted by macroeconomic conditions, regulatory developments, and overall market sentiment. As promising as the project may be, investing in it should always be approached with caution and a solid risk management strategy.
Disclaimer:
This trading idea is provided solely for educational purposes and should not be considered financial advice. Trading cryptocurrencies like LINK involves substantial risks, including the risk of complete capital loss. Always conduct your own research, evaluate your financial situation carefully, and consult with a licensed financial advisor before making any investment decisions. Past performance is not indicative of future results.
LINK START...Hello friends🙌
📈As you can see, the upward trend has started, and the power is in the hands of buyers, and here we have an opportunity to enter a buy trade with risk and capital management to move with the specified goals.
🔥Follow us for more signals🔥
*Trade safely with us*
