LINK/USDT Breakout SetupLINK/USDT Breakout Setup 🚀
LINK/USDT is gearing up near a major resistance level, with potential for a breakout 📈. If the price breaks above this level and confirms it with a retest as new support, we could see a strong bullish movement follow 💥.
🔍 Key aspects to monitor:
1. Breakout confirmation: A solid close above the resistance level.
2. Retest: Look for the breakout level to hold as support.
3. Volume surge: Increased volume during the breakout can strengthen the momentum.
⚠️ Keep a close eye on this pair, but remember, this is not financial advice. Always DYOR (Do Your Own Research) before making any moves. 📊
LINKUSDT trade ideas

Chainlink Set to Surge As Chart Shows Bullish Breakout Incoming Chainlink ( BIST:LINK ), a prominent decentralized oracle network, is capturing attention with a substantial platform upgrade unveiled at the 2024 SmartCon event and a potential breakout from a powerful technical formation. Currently trading within a significant symmetrical triangle, Chainlink’s price trajectory could be set for a 50% surge, potentially reaching $15 to $20 if bullish sentiment continues to build.
Key Developments in Chainlink’s Platform: Introducing the Chainlink Runtime Environment (CRE)
At SmartCon 2024, Chainlink co-founder Sergey Nazarov introduced the Chainlink Runtime Environment (CRE), marking a significant milestone for the platform’s evolution. The new CRE aims to address the modularity and security demands of the rapidly evolving blockchain landscape. Through this upgrade, Chainlink ( BIST:LINK ) not only reinforces its place as a decentralized bridge connecting blockchains with real-world data but also enhances its flexibility and scalability for developers across diverse industries.
CRE's modular and extensible architecture is a leap forward in design, allowing developers to integrate essential functionalities like on-chain data access and API interactions with ease. This is made possible through decentralized oracle networks that maintain a high-security environment, ensuring that each operation remains isolated and independently secure. This structure is particularly beneficial for industries such as capital markets, where complex data processing workflows require both security and adaptability.
Additionally, the CRE upgrade supports a gradual, user-friendly transition for current users. This strategic rollout ensures that existing workflows are not disrupted while granting developers access to Chainlink’s advanced features and decentralized security measures. Through this innovative architecture, Chainlink ( BIST:LINK ) stands ready to scale interoperably across numerous blockchains, meeting the expanding demands of capital markets and Web3 applications alike.
Chainlink's Modular, Composable Architecture: A Future-Proof Solution
This latest Chainlink update introduced a modular, composable architecture across multiple chains. It allows developers to design solutions using standardized components and familiar programming languages, offering customization without the need to consider chain-specific constraints. This approach caters to the decentralized finance (DeFi) and capital markets sectors, where complex, cross-chain solutions are increasingly essential.
Chainlink’s vision for CRE aligns with the needs of large-scale enterprises that require adaptable, multi-functional blockchain applications. By connecting smart contracts to real-world data, APIs, and payment systems, Chainlink provides secure, trustless communication between blockchain networks and external sources. This key upgrade underscores Chainlink’s dedication to expanding its platform to accommodate a wider range of blockchains while ensuring scalability and usability for developers.
Technical Analysis
From a technical perspective, Chainlink’s current trading pattern presents a notable opportunity. As of the time of writing, BIST:LINK is trading up by 2.12%, continuing to consolidate within a large symmetrical triangle. This pattern, formed when price movements become progressively tighter, typically indicates a potential breakout, either up or down. Given the current momentum, a bullish breakout could trigger a significant rally, with BIST:LINK possibly reaching the $15 to $20 range, marking an approximate 50% increase.
Key indicators support this bullish outlook
With an RSI at 58, Chainlink ( BIST:LINK ) is currently positioned to break out of the symmetrical triangle. The RSI in this range suggests potential upward momentum without being overbought, aligning with a possible breakout scenario.
Additionally, the emergence of a three white crows pattern—a candlestick formation that signals a bullish continuation or reversal—reinforces the likelihood of a strong upward trend. Typically, this pattern appears after a downtrend or within a consolidation phase, signaling renewed buying interest and an optimistic market sentiment.
If BIST:LINK successfully breaks through the upper boundary of the symmetrical triangle, the cryptocurrency could rally substantially. This price action could attract further interest from investors, amplifying Chainlink’s momentum and broadening its appeal.
Conclusion
With the unveiling of the Chainlink Runtime Environment, Chainlink ( BIST:LINK ) continues to position itself as a fundamental player in the decentralized oracle sector. This upgrade, aimed at modularity, flexibility, and cross-chain operability, has the potential to expand Chainlink’s impact on blockchain ecosystems and attract a more extensive developer and enterprise base.
As Chainlink ( BIST:LINK ) hovers within its symmetrical triangle pattern, the market is eagerly awaiting a breakout. With supportive technical indicators and ongoing platform advancements, Chainlink holds the potential for significant appreciation in the near term, underscoring its evolving role in connecting blockchain applications with the outside world. Investors and developers alike will want to keep an eye on Chainlink ( BIST:LINK ) as it stands at the intersection of fundamental innovation and promising technical movement, positioning BIST:LINK for a potentially transformative future.

$LINKUSDT: Breakout Alert!BINANCE:LINKUSDT is currently forming a symmetrical triangle pattern on the chart, indicating a potential breakout. After an extended consolidation phase, the price action suggests that LINK may be on the verge of a significant move. Traders should monitor key resistance and support levels as the price approaches the apex of the triangle. A confirmed breakout above resistance could signal a strong upward trend, particularly if it is accompanied by increased volume.
This setup presents an exciting opportunity for traders, as a decisive break could ignite a substantial upward movement. With the potential for a powerful rally after a lengthy period of consolidation, now is the time to stay alert for breakout signals. Always conduct your own research and consider your risk tolerance before making trading decisions.
BINANCE:LINKUSDT Currently trading at $12
Buy level: Above $12
Stop loss: Below $10.5
TP1: $13
TP2: $15
TP3: $19
TP4: $22
Max Leverage 3x
Follow Our Tradingview Account for More Technical Analysis Updates, | Like, Share and Comment Your thoughts

LINK Thesis AIAs a trader specializing in intraday scalping strategies for Chainlink (LINK), the current market conditions present a favorable opportunity to capitalize on short-term price movements. The current price of LINK is $11.9300, with a significant trading volume of approximately 159,930.5300. The long-short ratio indicates a strong bullish sentiment, suggesting that many traders are expecting the price to rise. Given the absence of current positions, this is an opportune moment to consider opening a long position.
Data Analysis
Open Interest: Steadily increasing, indicating growing market participation.
Weighted Funding Rate: Currently positive, which is a bullish signal.
Liquidation Levels: Relatively low, suggesting that there is not an overwhelming amount of leveraged positions that could lead to forced selling.
Analysis: The increasing open interest and positive funding rate support the bullish sentiment observed in the market, while low liquidation levels provide a cushion against sudden price drops.
Binance Data
Trading Volume: Supported by a recent uptick in trading volume, crucial for scalping strategies.
Market Sentiment: Leaning towards bullish, with many analysts predicting potential upward movement in the next few hours.
Expert Predictions:
Suggest LINK could see a price target of around $12.5000 if the bullish momentum continues.
Key Levels:
Resistance: $12
Support: $11.6700 and $11.4100
Analysis: Experts emphasize monitoring key resistance and support levels and considering long positions as LINK approaches these levels.
Circulating Supply: Approximately 1 billion LINK tokens.
Market Capitalization: Approximately $5.2000 billion.
24-Hour Trading Volume: $1,599,305.3000, indicating strong trading activity.
Analysis: The robust trading volume and stable market capitalization support the bullish outlook for LINK, as increased trading often correlates with price movements.
Sentiment Analysis
Sentiment Score: 75%, indicating a predominantly positive sentiment towards LINK.
Top Crypto Sentiments: Majority of social media discussions lean towards bullish predictions.
Implications: Aligns with technical indicators and financial data, reinforcing the case for potential long positions.
Technical Analysis
RSI (Relative Strength Index)
Value: 57.4100
Interpretation: Indicates a neutral position, neither overbought nor oversold, suggesting potential for upward movement.
MACD (Moving Average Convergence Divergence)
Status: Positive, supporting the idea of upward momentum.
Stochastic Indicators
Status: Favorable, suggesting potential bullish momentum.
Moving Averages
20-Day and 50-Day Moving Averages: Price is currently above both, reinforcing the bullish trend.
MA20: $11.8000
Price Positioning
Support Levels: $11.6700 and $11.4100
Resistance Level: $12
Analysis: The price is consolidating around the support levels. A break above the resistance level of $12 could signal a strong upward trend.
Bollinger Bands
Current Position: Approaching the upper band, indicating potential resistance at $12.
Implications: A breakout above this level could lead to further gains, while failure to break could result in consolidation or pullback.
Summary
The current market conditions for Chainlink (LINK) indicate a bullish trend supported by increasing open interest, positive funding rates, and optimistic market sentiment. Technical indicators suggest potential upward momentum, with key resistance levels at $12 and support levels at $11.6700 and $11.4100. The significant trading volume and positive sentiment from both analysts and retail investors reinforce the potential for short-term gains through intraday scalping strategies. However, maintaining vigilance is crucial as technical indicators like RSI approach neutral levels, which could lead to a pullback or consolidation.
Trade Recommendation
Outcome: OPEN_LONG
Confidence Level: 85%
Current Price: $11.9300
Stop Loss: $11.6500
Take Profit: $12.5000
Exit Point: $12
Entry Criteria
RSI: Below 65 indicates potential upward movement.
Price Breakout: A break above $12 will signal an OPEN_LONG position.
MACD: Positive, supporting bullish momentum.
MA10: $11.8000 suggests continuation of the trend.
Current Indicators:
RSI: 57.4100
MACD: Positive
MA10: $11.8000
Action Plan
Monitor the Price Closely:
Breakout Strategy:
If Price Breaks Above $12:
Action: Open a long position.
Adjust Stop Loss: Tighten the STOP_LOSS to $11.7000 to minimize potential losses.
Take Profit Strategy:
As Price Approaches $12.5000:
Action: Consider taking profits.
Adjust Exit Point: Move the EXIT_POINT to $12 to secure profits.
Risk Management:
Set Stop Loss at $11.6700 to limit potential losses.
Take Profit at $12.5000 to capitalize on expected price movement.
Exit Point at $12 as an intermediate target.
Be Prepared to Act:
If RSI Falls Below 50:
Action: Indicate a potential reversal; consider taking profits or adjusting positions accordingly.
Monitor Market Sentiment:
Stay informed about any changes in market sentiment or technical signals that could impact the trade outcome.

Link usdt I think link is also ready to move higher hopefully at 13 for an 8% profit at least . Coins seems to starting gaining momentum as btc stalls for now we will see if alts start to gain some more market share . Might close the position is link loses the daily support shown on the red lines .

Chainlink, Bitcoin, The Altcoins Market & New All-Time HighsChainlink (LINKUSDT) is currently trading 48% lower compared to mid-March 2024. And 69% below its November 2021 peak price... Isn't this strange?
When Bitcoin grows, the Altcoins boom. In fact, the Altcoins tend to move much sooner and much stronger than Bitcoin on their Tether (USDT) pairings.
I am looking at pairs such as Chainlink, Ethereum, Avalanche, Cardano, Aave, Polkadot, NEAR, Dogecoin, XRP, Litecoin, Uniswap, Pepe and the rest, and they are all trading pretty low compared to historical highs and the latest bullish wave peak (around March 2024). Bitcoin is trading at All-Time Highs, what is happening here?
Will the Altcoins start a bullish impulse to match Bitcoin?
This is definitely a possibility but the chart is mixed.
Here we have LINKUSDT consolidating higher within an ascending triangle but at the same time facing lower highs and a clear downtrend since earlier this year.
If Bitcoin continues higher, this is sure to produce enough momentum to pull the entire Altcoins market up. Tether just minted $1,000,000,000 USDT, maybe this can work.
On the other hand, if Bitcoin's bullish move ends at a double-top, same price range as in March 2024 and a repeat of 2021 (a peak in April followed by one in November —now, a peak in March followed by one in October), this would mean we would enter a correction next.
Which one of the two is the most likely scenario?
There is growth on the Bitcoin side but there is something missing, there is no participation from retail and the market seems dead.
The Altcoins we are tracking are all down, most of them, so the money was extracted from the Altcoins market to push Bitcoin up. When the market is entirely bullish, we see growth on all sides but this time, it is kind of mixed and we are not seeing the Altcoins growing such as the group mentioned above.
Definitely bearish at resistance.
Bullish at support.
Patience is key.
When the market is mixed, because whales are at work.
Namaste.

LINK USDTLINK USDT is looking good after a long correction the price has been moving in a descending channel since March. After a confirmed breakout from the upper boundary of a descending channel and the resistance zone in Green at $12.52 - $13.03 the target will be the March height at $22.87.
All the targets are marked on the chart.
Everything is on the chart

can it be valid for this chart?seems like we have a perfect 5 wave up and then a complex retracement
and due to fibo retracement it must be a wave 1 and 2 and it is just the beginning

Great area to LONG & SHORT!We have found temporary support above the range POC. and weekly level. I'm expecting the local lows into POC to be swept then bounce back into VAH/Daily/GP, then VAL for a bounce to range highs. VAL can also get tested first.
#Chainlink
Calculate Your Risk/Reward so you don't lose more than 1% of your account per trade.
Every day the charts provide new information. You have to adjust or get REKT.
Love it or hate it, hit that thumbs up and share your thoughts below!
This is not financial advice. This is for educational purposes only.

🚀 LINK - ROCKET ON LAUNCH 🚀Hello everybody!
I think that most likely in the medium term there will be an increase to 382 fibs ($ 23.6), then you need to look.
❌ Stop - $5.38
⚠️ As always, I wish you good luck in finding independent thoughts and profit ✊
Goodbye!

LINK being scary! We are bound for a wave 3 as we have made a massive wave 1 and currently we are trading above value of local range!
I'm longing on 11.71 as its bottom to the entire rise to the upside.
A possible wave 3; a possible 200% rise!

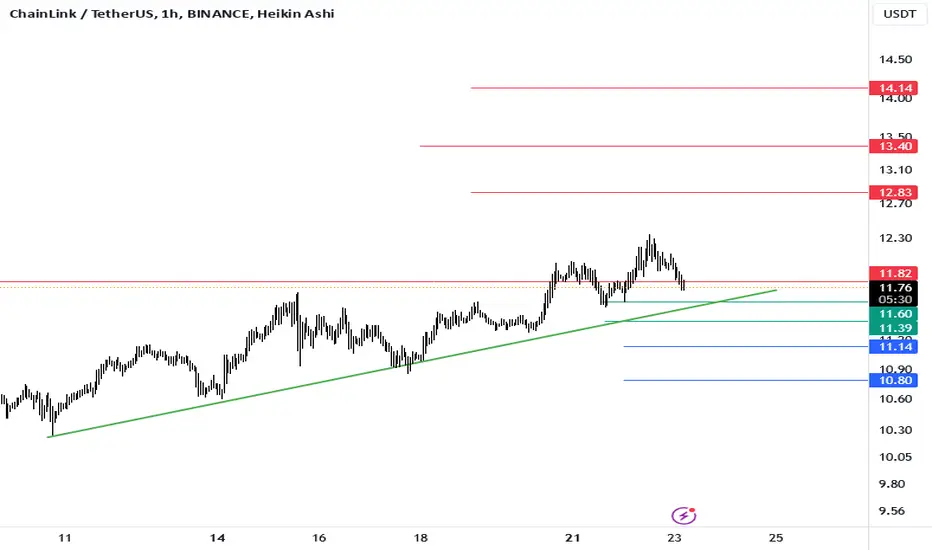
LINK Poised for Liftoff: Strong Support, Bullish SignalsChainlink has formed a robust support level between $9-$11, holding steady four times on the daily chart and now showing signs of a breakout! 📈
Key Highlights:
📊 Decisive Break Above $11.50 Resistance: LINK has surged past the $11.50 mark, signaling a strong uptrend formation.
💪 Strong HVN Support: A significant High Volume Node around the $11 region reinforces this sturdy support level.
🕒 Short-Term Bullish Indicators: On the 1-hour chart, LINK has moved above the VWAP, 20 EMA, and 50 EMA, and the RSI has crossed above 50—positive short-term signals.
🎯 Potential Upside Levels: If the upward momentum continues, LINK might approach the $12.75 level. A further breakout, especially if Bitcoin (BTC) breaks its resistance, could see LINK reaching the $14-$15 area.
⚠️ Key Support Levels: In terms of risk management, traders are observing levels like $11.50 (aggressive stop loss) and down to $10.15 if swing trading.
🌐 Positive Market Sentiment: Bitcoin (BTC) appears bullish, with a breakout seeming imminent, which often bodes well for altcoins like LINK.
💰 BTC Support at FWB:67K : Bitcoin has found support and bounced at $67,000, strengthening the overall market outlook.
🏦 Time-Tested Hold: LINK is considered by many as a solid, time-tested asset for the upcoming bull run.
With confluence from multiple technical indicators and bullish market sentiment, LINK shows potential for an upward move! 🌟

CHAINLINK SWING TRADINGSwing trading
BINANCE:LINKUSDT
Seeing that the structure has been respected, I decide to open a position now. These are my arguments:
Bullish arugments:
Monthly PCL being disrespected
Weekly PCL being disrespected
Daily swing low being disrespected
4H swing low being disrespected
So far I see no bearish arguments.
Trade management:
SL at $9.94 which that would indicate strong rejection and would power a search for liquidity at the lower end of the range. However, there does not seem to be so much weakness to look for a lower low than the September low.
TP, partials could be obtained. A partial TP would be on liquidity on the buy side at $13.90 and let profits run to ITH with SL on BE once the 1TP profit is taken.

LINKUSDT / H1 / SHORTLINKUSDT may experience a downfall from the Bearish Order Block!
LINKUSDT is nearing a significant resistance zone. The pair touched this zone a few hours ago and has begun moving downward. Based on the market behavior, we can expect a potential decline of around 2.5-3% from the resistance zone.
Resistance Zone: 11.67 and 11.55
The price has already reacted to the resistance, and it appears there are high chances of a further decline. Let's see how the market unfolds from here.
Entry price :- 11.45
Take profit :- 11.15
Stop loss :- 11.78

Buy Trade Chainlink: Leveraging Decentralized Oracle NetworkTitolo:
Buy Trade Chainlink: Leveraging Decentralized Oracle Network Growth
Descrizione:
This trading idea focuses on Chainlink (LINK), a leading decentralized oracle network that bridges blockchain technology with real-world data. Chainlink's core value lies in its ability to provide secure, tamper-proof data for smart contracts, enabling a vast array of blockchain use cases, from DeFi to insurance. As more projects integrate Chainlink's oracle services, its role in the ecosystem strengthens, positioning LINK as a key player in the future of decentralized technologies.
The growing adoption of Chainlink by both developers and enterprises, combined with its expanding network capabilities, highlights its strong fundamentals. However, it's crucial to remember that the cryptocurrency market is highly volatile, and price movements can be influenced by external factors such as regulatory changes or technological advancements.
Disclaimer:
This trading idea is for educational purposes only and should not be considered financial advice. Cryptocurrencies are highly speculative and carry significant risk, including the potential for a complete loss of capital. Always conduct your own research, assess your financial situation, and consult with a professional financial advisor before making any investment decisions. Past performance does not guarantee future results.

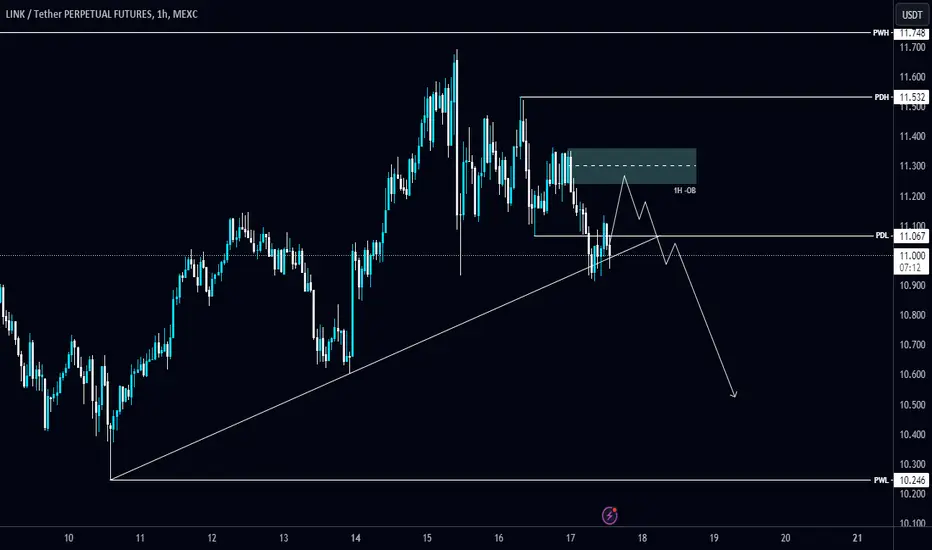
#LINK/USDT is holding the Diagonal Trendline in 1-Hour TF!#LINK/USDT is holding the Diagonal Trendline in 1-Hour TF!
Wait for 1H bearish Order Block to short $LINK. The local resistance level is PDH's $11.53, and the support level is PWL's $10.245.
Chainlink Price Poised for a Breakout: Can $LINK Reach $13?Chainlink ( BIST:LINK ), one of the most talked-about cryptocurrencies in the blockchain space, is showing signs of a potential breakout this October. After a volatile few months, the token has seen steady gains, rising from $10.60 to $11.13—a nearly 4% increase within the last week. This upward movement, alongside promising network developments and technical indicators, has investors speculating on whether the token can surpass the $13 mark in the near term.
Technical Outlook: Chainlink’s Path to $13
Technically, Chainlink’s price action presents both challenges and opportunities. The token is currently trading below its 200- and 100-day moving averages (MAs), reflecting a cautious market sentiment. However, the narrowing of the Bollinger Bands suggests a breakout could be on the horizon, with $13 as a potential upside target. Additionally, the MACD indicator is converging into a positive territory, hinting at a bullish momentum that may push the price higher in the coming days.
Despite some recent bearish signals, including a 2.53% decline as of this writing and a moderate RSI of 50.03, the token has held strong above key support levels. The next major test for Chainlink ( BIST:LINK ) will be overcoming the $12 pivot, a point seen by analysts as a significant resistance. If BIST:LINK breaks through, it could solidify the move to $13, especially given the bullish environment often associated with "Uptober"—a historically favorable month for cryptocurrencies.
Drivers of Chainlink’s Growth
Chainlink’s recent network upgrades and strategic partnerships are driving its price momentum. The introduction of staking has boosted investor confidence, offering them an opportunity to lock up tokens and earn rewards, reducing the circulating supply and increasing scarcity. Moreover, Chainlink’s Oracle services, which provide secure and reliable off-chain data to smart contracts, have expanded with the integration of Secure Mint.
The adoption of Chainlink’s Cross-Chain Interoperability Protocol (CCIP) by major players like Ronin, the gaming-focused EVM blockchain, is further strengthening the network’s ecosystem. As more platforms adopt Chainlink’s technology, the demand for LINK tokens continues to rise.
Whale Accumulation and Market Sentiment
Chainlink’s whale activity has surged, which is often a bullish signal. According to data from Santiment, the number of large BIST:LINK holders has increased from 489 to 502 in early October. Whale accumulation typically indicates that major investors expect the price to rise in the future, reinforcing the narrative of a potential breakout. Additionally, increased active addresses and transaction volumes reflect growing interest and usage of the Chainlink network.
Increased whale activity also raises the possibility of a short squeeze. Many traders currently hold short positions, and if Chainlink ( BIST:LINK ) can break through the $12 resistance, it could force short sellers to cover their positions, leading to a rapid price increase.
Potential Risks and Support Levels
While Chainlink’s future looks bright, there are risks to consider. The token remains vulnerable to broader market corrections, and a failure to hold above the $10.27 support level could see it retrace further, potentially to the $9.50 mark. Additionally, its underperformance compared to Bitcoin ( CRYPTOCAP:BTC ), which has seen stronger gains in recent days, highlights the possibility of more bearish moves if the overall market sentiment shifts.
However, if Chainlink ( BIST:LINK ) can continue building on its network upgrades and overcome key technical hurdles, the stage is set for a strong October performance, with $13 well within reach.
Conclusion: Is Chainlink Set for a Rally?
As of now, Chainlink is positioning itself for a potential breakout above $13, with the technical indicators and fundamental drivers both supporting an optimistic outlook. Increased whale activity, low exchange reserves, and major network developments all contribute to the bullish sentiment around the token. While the token faces immediate resistance at the $12 pivot, a successful breakout could set Chainlink on a bullish trajectory for the rest of October and beyond.

$LINK is going to break the line soon#link is going to break the line soon, I'm opening a long position x15 with the first TP at 15.5.

LINK/USDT 1W chart reviewHello everyone, let's look at the current situation of LINK 1W interval. In this situation, we can see the price rebounding from the downtrend line.
Let's start by setting goals for the near future, which include:
T1 = $11.49
T2 = $13.66
T3 = $15.54
T4 = $17.27
Now let's move on to the stop-loss in case the market continues to decline:
SL1 = $9.27. SL2 = $7.35. SL3 = $5.53
Looking at the RSI indicator, we see
as the movement took place in the upper range, which could have influenced the change in the direction of movement, giving a price recovery.

LINK USDT- CLICK HERE TO CHECK NEW ANALYSISThe breakout will decide the direction. We can go bullish or bearish, depends on bitcoin! Waiting for key zone

#LINK/USDT#LINK
The price is moving within a descending channel pattern on the 4-hour frame and is expected to break upwards after it has adhered to it to a large extent
We have a downtrend on the RSI indicator that is expected to break upwards and we have a trend to stabilize above it
We have a major support level in green at a price of 8
We have a trend to stabilize above the moving average 100, which supports the rise
Entry price 9.40
First target 11.32
Second target 12.63
Third target 13.86

