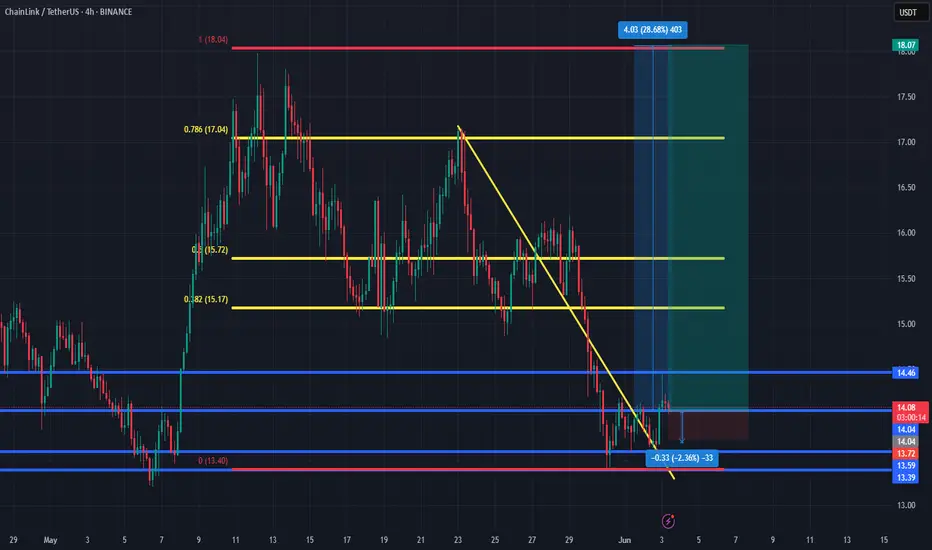
LinkEntry price yellow line
Stop loss update from red line to yellow line
We hit first Take profit
I Close full now
LINKUSDT trade ideas

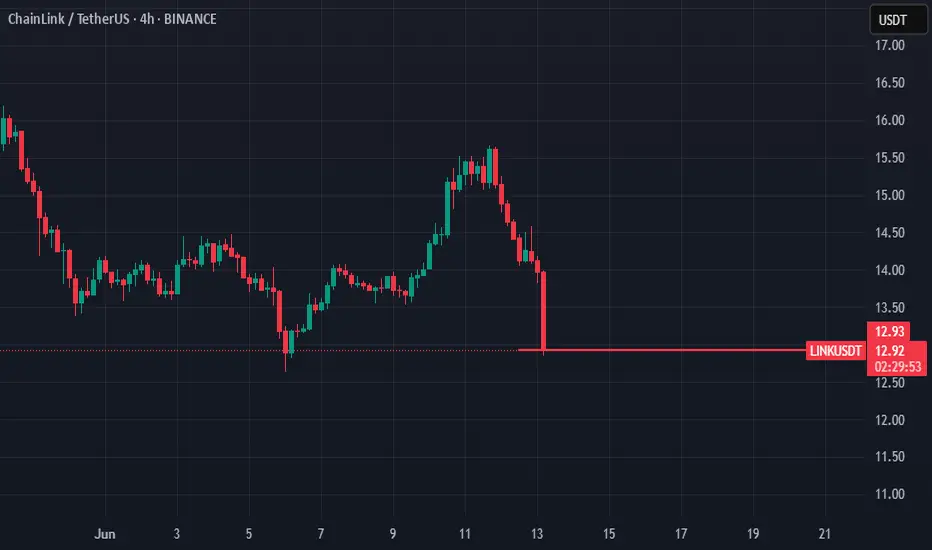
Chainlink Price on 14/June/2025Chainlink is trading at 13.25$ as of 14/June/2025. In Next week, It need to retest at 12.4$ -12.6$ before it break 15.51$. To claim the bull the price should be 20$.


linkusdt is in pumping conditionlink can break daily resistance. can good give profits in upcoming market conditions

Weekly trading plan for LINKLink has already reached his 3rd target of the week. The chart shows divergence, but now the price above the monthly pivot point and there is a chance to see a continuation of growth. If it returns under monthly PP we may see a local correction or a deeper one to the weekly PP level
Write a comment with your coins & hit the like button and I will make an analysis for you
The author's opinion may differ from yours,
Consider your risks.
Wish you successful trades ! mura

LINK Structure Shaping Up for Potential BreakoutvChainlink is now approaching a key resistance trendline after showing a strong bounce from the recent demand zone.
Price is pushing into this trendline with good momentum. If we see a clear breakout and daily close above it, this could open the door for a continuation move toward the next target area around seventeen point seven dollars.
However, this is still an important level to watch. If the trendline holds and price gets rejected, a pullback toward the demand zone near fourteen dollars is possible.
At this stage, the chart is showing a constructive setup. It’s worth keeping an eye on how price behaves here in the coming sessions.
Thanks for reading

link updateentry price 15.48
stop loss 15.48
take profit
11.9
10.95
we hit first and second take profit

$LINK / USDT – Indicators Not Maxed, Big Picture Thinking.ChainLink is hovering just above Buy Zone 2 — price hasn’t tapped it yet, but it's close. This zone around $13.21 to $12.50 remains the key area of interest. If the market gives us that dip, it could be a solid spot for high-conviction entries.
Looking at the 3D timeframe, indicators like the MACD, stochastics, and other oscillators are nowhere near overheated. We’re not seeing blow-off tops or maxed-out momentum — which tells us this market still has room to run. At the same time, it’s not “cheap” forever.
If you're thinking longer-term, this is the kind of setup where reasonable, staggered accumulation makes a lot of sense — especially in utility-heavy, fundamentally proven projects like ChainLink. You don’t need to go all-in, but building exposure in anticipation of a reaction from these zones is a rational approach.
Key Levels:
🟢 Buy Zone 2: Untouched, watching $13.21–$12.50
🟢 Buy Zone 3: $11.95–$10.00 (big bids if BTC corrects)
🔴 TP1: $15.15
🔴 TP2: $19.50
🎯 Final Target: $22.25–25.00
📈 We may not have the entry yet — but the structure is shaping up.
📡 Follow @BahtMover on X for real-time entries, updates, and volume-driven setups.

Link | Long | 1hrThis technical analysis is for informational and educational purposes only. It does not constitute financial advice. Remember to always research and consult with a professional before making investment decisions. Good luck! 📈💼🚀

Chainlink (LINK): Looking For Target of 200EMA (Daily)Chainlink has done very well, and we have also opened one long position near the breakout area at $14. Now we are looking for the price to have a proper retest after what we expect to see some downward movement so eyes on the daily 200EMA line for now!
Swallow Academy

Chainlink Support Remains Intact, Short-Term Noise (10X)Notice here Chainlink on the weekly timeframe. This week wicked below our strong support on the chart marked by a blue dashed line, this level is the 0.618 Fib. retracement ratio. The baseline of the v shaped bottom and also the bottom formation of 2024.
The retrace, bearish action, so far has been going for four straight weeks. The entire rise was five weeks longs. I mentioned this previously. This means you can easily go ALL-IN on this type of chart setup, buy and hold.
The retrace can never be longer than the drop. The fact that support is holding means that Chainlink will continue growing, will resume its bullish wave. A bullish continuation.
This is a friendly reminder. I know it is hard, but this type of setup is where experts open LONG with 10X. I am not saying that you should, I just want to show you how we are attracted to and tempted to buy when the market is red. That's the time to go LONG. We sell (SHORT) when the market is green.
Thank you for reading.
Namaste.

LINK's situation+ Target PredictionSo if you pay attention to the LINK chart you can see that the price has formed a Ascending wedge which means it is expected to price move as equal as the measured price movement.( AB=CD )
NOTE: wait for break of the WEDGE .
Give me some energy !!
✨We spend hours finding potential opportunities and writing useful ideas, we would be happy if you support us.
Best regards CobraVanguard.💚
_ _ _ _ __ _ _ _ _ _ _ _ _ _ _ _ _ _ _ _ _ _ _ _ _ _ _ _ _ _ _ _
✅Thank you, and for more ideas, hit ❤️Like❤️ and 🌟Follow🌟!
⚠️Things can change...
The markets are always changing and even with all these signals, the market changes tend to be strong and fast!!

LINK. USDTThe nature of the market itself is risky and tense.
Therefore, entry and exit must be done with more caution.
So:
I am going to buy the link between $8 and $10, or at least buy a step. but I will complete my purchase at the indicated price.

LINK Long Setup – Retrace to Key Support After Strong RallyLINK saw a strong rally from April to mid-May, and is now undergoing a healthy retracement. Price is approaching the $13.00–$13.50 support zone, offering a potential long spot entry as the market cools.
📌 Trade Setup:
• Entry Zone: $13.00 – $13.50
• Take Profit Targets:
o 🥇 $15.00 – $16.00
o 🥈 $17.00 – $18.00
• Stop Loss: Daily close below $12.00

TradeCityPro | LINKUSDT Chart Primed for a Big Move! 👋 Welcome to TradeCityPro Channel!
Let’s dive into analyzing one of the market’s most popular coins, LINK, which continues to hold its key supports in higher timeframes and is poised for strong moves during a market uptrend.
🌐 Overview Bitcoin
Before starting the analysis, I want to remind you again that we moved the Bitcoin analysis section from the analysis section to a separate analysis at your request, so that we can discuss the status of Bitcoin in more detail every day and analyze its charts and dominances together.
This is the general analysis of Bitcoin dominance, which we promised you in the analysis to analyze separately and analyze it for you in longer time frames.
📊 Weekly Timeframe
On the weekly timeframe, LINK has been one of the cryptocurrencies that remained in a range for 500 days. After breaking out, we have seen the beginning of an uptrend.
This is exactly what I mean by avoiding capital lock-up. We waited weeks for the 8.06 trigger to break, allowing us to buy with momentum confirmation rather than buying inside the range and waiting in a high-risk market.
You might say, "Why not buy inside the range to avoid missing the 8.06 breakout?" My answer is that hundreds of coins are still stuck in similar ranges without showing any bullish moves, and even now, they could trap your capital for a long time, causing frustration!
Currently, we can say that after a price rejection at 18.10, we’ve pulled back, and if selling volume increases, we’ll go to test the 9.06 level, but if we form a higher low, we’ve created a good trigger for a buy!
📈 Daily Timeframe
On the daily timeframe, LINK is one of the few cryptocurrencies that, after recent corrections, did not return to lower levels. Instead, it bounced off the 0.382 Fibonacci level, increasing the bullish bias.
After breaking 12.96, LINK had a strong rally up to 29.07, where resistance was observed.
Instead of considering 29.07 as resistance, I prefer to buy after a breakout of 26, as this level was previously a pullback zone and had multiple rejections.
On the daily timeframe, we’ve also been rejected from a strong resistance, which further emphasizes the importance of this daily resistance, and it’s better to say that as long as we’re above the 11.99 support level, the 17.45 resistance will be the best trigger for a spot buy and our entry!
📝 Final Thoughts
Stay calm, trade wisely, and let's capture the market's best opportunities!
This analysis reflects our opinions and is not financial advice.
Share your thoughts in the comments, and don’t forget to share this analysis with your friends! ❤️


Chainlink Next Move Now Imminent, Strong Setup (8X)I still think that Chainlink has a strong chart setup that can start moving any time without warning.
The rise from 7-April lasted only six weeks and later the retrace lasted 3 weeks. That's 50% of the time. The sixth week that produced the peak was also a red week. When a pair is about to start moving, this is already a strong enough retrace. Three weeks out of a total of eight would be a perfect retrace, both are fibonacci numbers.
The retrace pierced the 0.5 Fib. retracement level and started to recover right above 0.618. The last candle close happened above 0.5. In short, this is perfect bullish price dynamics.
What's more, the short-term 0.618 Fib. retracement level here also marks the breakdown and recovery from July-November 2024. Back then we had a long bottom pattern and this time a short-term one. Another perfect pattern and classic; Elliotts law of alternation.
We have a good one here. I think Chainlink can be a win for us but only time will tell of course.
I thank you for reading.
First leave a comment and then follow.
Thanks a lot for your continued support.
Namaste.

ChainLink - SetupCurrently in a long swing position on CRYPTOCAP:LINK
Tp1 + BE : at $18 — recent highs
Tp2: at $20.5 — trend reversal area
Tp3: at $26.2 — target region
If you have any questions about my system or trade logic, drop them below — I read every comment 👇

LinkUSDT will take a few days to get back on trackLinkUSDT will take a few days to get back on track

LINK It has good growth potential in midtermWhat I see now is that the price could correct to the PRZ and then pump again, and currently, there is no specific bullish pattern in the chart. which could cause the price to drop below 13.5 dollars.
Best regards CobraVanguard.💚

LINK D1 LONG POSITIONyou can open long position and forget it. on D1 demand and has a confirmation on H1

Chainlink Buys to continue uptrend 🔍 1. Technical Analysis
Uptrend Continuation Indicators:
Higher highs and higher lows on the daily or 4H chart.
Key resistance levels: Watch if LINK breaks and holds above resistance (e.g., $18–$20 zone).
Moving averages: Trading above the 50-day and 200-day moving averages can support bullish momentum.
RSI/MACD: RSI between 50–70 and a MACD crossover can support continued momentum without overextension.
📈 2. Fundamental Catalysts
Partnership announcements or oracle integrations with top blockchains (like Ethereum L2s).
Staking growth: More LINK being staked (especially in Chainlink Staking v0.2) = reduced supply, potentially boosting price.
Adoption trends: More protocols relying on Chainlink oracles means higher demand.