LINKUSDT SHORT OUTLOOKHello Traders, this is outlook that i think might be work. All Entry, Stop Loss, and Take Profit its already showed up. All trade it is on yourself. DYOR.
LINKUSDT trade ideas

LINKUSDT: EW Analysis in 4hr timeframeHello guys. According to the chart of Linkusdt we see the price in the fitfth wave of wave 3 . and will be touch the 25$ so by using the stop lost trategy we tought about long position

ChainLink long idea I believe that one of these two scenarios will come true and I still think it is bullish for the crypto market.

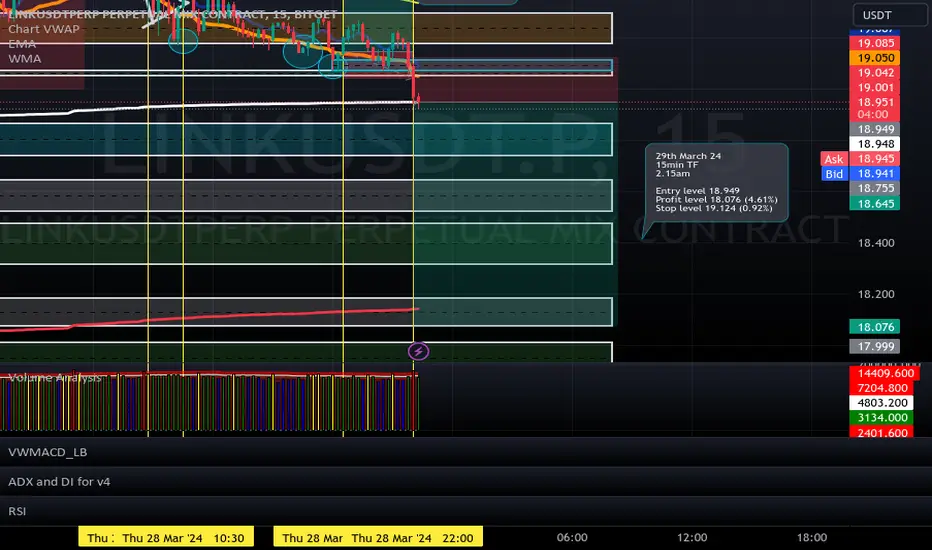
Short trade29th March 24
15min TF
2.15am
Entry level 18.949
Profit level 18.076 (4.61%)
Stop level 19.124 (0.92%)
15min TF
2.15am
LINKUSDT.PHello Trader BINANCE:LINKUSDT.P
the link market is experiencing a consolidation area, but looking at the small time frame 30 minute to 2 hour area there is a critical area that could be a potential area to take short positions.
-the upper green dot is a small supply area
-the lower green dot is daily support
take profit 15%
stop loss 3.5%
Please add a comment and Positive feedback and constructive criticism are important to authors and the community.
Disclamer: Not Financial Advice

Long trade Pair: LINKUSDT
28th March 24
15min TF
18.30pm
Entry 9.963
Profit level 9.963
Stop level 19.024
Comments:
Currently, 35% of active LINK addresses are in a profitable position, with an additional 60% sitting at the break-even point. This effectively means that approximately 95% of LINK holders are not facing any losses from their current holdings, creating a robust foundation for market confidence.


LINK Shortwe got the wave B of the correction ready and move down to end the correction at wave C between 14/9 USD

Chanlink(LINK): Looking For Rejection Near ResistanceChainlink has broken EMAs with a strong burst, which seems like good momentum to touch that upper resistance zone.
From there on, we are going to see a nice rejection and a potential movement towards EMAs as a re-test, but we might also see a cup and handle pattern, so eyes open!
Swallow Team

LINKUSDT BUY IDEATrending bounce
Market structure break
Bullish triangle
Double bottom
Bullish pennant
Head and shoulder formation
RSI MFI is green
Small bullish wave
VWAP crossing
Possible next zone is 24 if we break and confirm 20 area zone

LINK InteligentAssetBullish scenario
Resistances 19.43, 21.64, 23.3 upper limit channel, 25.65, 28.56
Bearish scenario
Supports 18.8 in 50 ema, 18.2,
17.6 ascending trend &
lower limit channel, 14.9 in 200 ema

LINK LOOKING VERY STRONG ! Waiting for pull back to daily breaker block to look for opportunities to enter position with good profit and loss.

LINK can ascend further!Hi.
BINANCE:LINKUSDT
✅Today, I want to analyze LINK for you in a Weekly time frame so that we can have a Short-term view of LINK regarding the technical analysis. (Please ✌️respectfully✌️share if you have a different opinion from me or other analysts).
LINK is testing the s/r zone right now on weekly timeframe🧐
Bullish if breaks above the one...
✅ Due to the Ascending structure of the chart...
🟢 High potential areas are clear in the chart.
🟢 S&R ZONE
Stay awesome my friends.
_ _ _ _ _ _ _ _ _ _ _ _ _ _ _ _ _ _ _ _ _ _ _ _ _ _ _ _ _ _ _ _ _
✅Thank you, and for more ideas, hit ❤️Like❤️ and 🌟Follow🌟!
⚠️Things can change...
The markets are always changing and even with all these signals, the market changes tend to be strong and fast!!

Link Long 20.678🚀Link Long 20.678
T🤖 he coin is approaching the daily level.
Directional movement
There is a stop cloud above the level
1st target 22.74

LINK - Bounce and go up ^#LINK/USDT #Analysis
Description
---------------------------------------------------------------
+ LINK is showing good bullish momentum and price retraced back and now it is bouncing back
+ This retracement is a good opportunity for a LONG trade
+ I'm entering a long trade with a good distance to the stop loss.
---------------------------------------------------------------
VectorAlgo Trade Details
------------------------------
Entry Price: 19.4
Stop Loss: 15.78
------------------------------
Target 1: 22.4
Target 2: 25.03
Target 3: 28.9
Target 4: 35.9
------------------------------
Timeframe: 1D
Capital Risk: 1-2% of trading capital
Leverage: 5-10x
---------------------------------------------------------------
Enhance, Trade, Grow
---------------------------------------------------------------
Feel free to share your thoughts and insights.
Don't forget to like and follow us for more trading ideas and discussions.
Best Regards,
VectorAlgo

LINKUSDT - Box is open and destination is 25$LINK consolidated heavily in inside the box with the range from 12 to 16, this was a good range for link to consolidate and get ready for the next target.
As the link is currently broken out of the consolidation box we can expect the price to reach 25$ easily.
We can enter position at current price (18.5$ ) and our first Target is 20$ and last target is 25$
Entry Price: $18.5
Stoploss: $15
TP-1: 20
TP-2: 22
TP-3: 25
Like and follow us for more ideas.
cheers
GreenCrypto

LINKUSDT RISELINKUSDT appears to be in a favorable buying zone, with a new fresh supply zone identified between 17 to 18.4. The decision to enter the market aligns with multiple technical indicators suggesting a buying opportunity.
Firstly, the technical rating is classified as 'buy', indicating a positive sentiment towards the asset's performance. This rating suggests that various indicators, such as moving averages (MA), Relative Strength Index (RSI), Momentum (MOM), and Commodity Channel Index (CCI), are showing signs conducive to buying.
The MA, a widely used trend-following indicator, is strongly signaling a buy, indicating a bullish trend in the market. This suggests that the price of LINKUSDT is likely to continue rising in the near term.
The RSI, currently at 52.2, is in a neutral position, neither overbought nor oversold. This suggests that there is room for further upward movement before the asset becomes overbought, supporting the notion of a potential buying opportunity.
MOM, at -17.2, indicates a negative momentum, but it's important to note that momentum indicators like MOM can often lag behind price movements. The fact that the price is within the identified buying zone suggests that momentum may shift upwards soon.
Similarly, the CCI, at -13, indicates a slight downward pressure, but it's relatively close to the zero line, suggesting a potential reversal or consolidation in the near future.
Managing risk is crucial in trading, and it's commendable that you've emphasized this aspect. When entering a trade, it's essential to have a clear risk management strategy in place. This could include setting stop-loss orders to limit potential losses and ensuring proper position sizing to protect your capital.
In conclusion, the technical analysis indicates a favorable buying opportunity for LINKUSDT within the identified zone. However, it's important to monitor the market closely and manage risk effectively to navigate potential fluctuations in price. By incorporating these technical insights into your trading strategy, you can make informed decisions and potentially capitalize on favorable market conditions.

LINK/USDT | 1W 👀For a whole year, we've been watching Bitcoin's rise, and everyone has already forgotten how painful the market can sometimes bleed.
Overall, I'm holding quite a bit of cash to average positions.
Soon, there will be an opportunity to buy altcoins at a good price, ones that have responded weakly to the market's rise but still have strong fundamentals. Among them is $LINK.
- Not financial advice, trade with caution.
✅ Stay updated on market news and developments that may influence the price of Chainlink. Positive or negative news can significantly impact the cryptocurrency's value.
✅ Exercise patience and discipline when executing your trading plan. Avoid making impulsive decisions driven by emotions, and adhere to your strategy even during periods of market volatility.
✅ Remember that trading always involves risk, and there are no guarantees of profit. Conduct thorough research, analyze market conditions, and be prepared for various scenarios. Trade only with funds you can afford to lose and avoid excessive risk-taking.
#Crypto #Chainlink #Investment #LINK

LINK - Swing Trade SPOT 📈📉Hi Traders, Investors and Speculators of Charts📈
BTC had recently formed a new ATH, and we're a few weeks away from the BTC halving. I'm expecting corrections (highly overdue) across the markets up until the halving.
Chain-link still has huge upside potential:
But this post is specifically for the short term. I'm looking at a swing trade (spot) here because it is already a high-risk trade , and shorting when the macro is clearly bullish is VERY risky business .
Make sure you check out yesterday's update on BTC:
If you found this content helpful, please remember to hit like and subscribe and never miss a moment in the markets.
_______________________
📢Follow us here on TradingView for daily updates📢
👍Hit like & Follow 👍
CryptoCheck
COINBASE:LINKUSD BINANCE:LINKUSDT

Long $LINKBIST:LINK breaking out of the local triangle, targeting at the next parallel fib channel.
We'll see how it works out in just a few hours.
Disclaimer: Opinions are my own.

The link continues to rise in price👉By examining the trend in the four-hour time frame, it seems that the link has broken the resistance range of the NECK LINE in the range of 18.31-18.12, and now, according to the increase in the averages of the ALIIHATOR indicator, the probability of the continuation of the upward trend is very high. .
In general, this scenario is reinforced that the link can be as high as the HEAD & SHOULDERS pattern, up to the Fibo resistance of 261.8%, provided that it does not register any 4-hour close candle time below the support interval in the range of 18.31-18.21. increase in the number of $21.50.🫸

IS LINK READY TO PUMP AGAIN?Link was one of the first altcoins to move during the early days of this bull market and has largely stalled since. This has caused sentiment to shift negative, as impatient traders call it “dead” and ask why it refuses to rise. They have short memories.
As you can see, LINK is still working on flipping key former resistance (the blue zone) to support. Last week’s candle was a beautiful dragonfly doji with a long wick down and small bodu. This is a reversal candle, right through that key support. A bullish candle this week would confirm a likely reversal. Perhaps it is time for LINK to move again, we shall see.
