CHAINLINK #LINKThe Link chart displays a rejecting bearish wick, indicating a potential short position on the 15-minute time frame.
LINKUSDT trade ideas

LINK Potential Bullish Momentum
Promising trading opportunity for LINKUSDT on the daily timeframe, employing Fibonacci retracement levels from the high to low. Currently priced at the critical ~ 20-21$ mark it appears to be at a key level, with the potential for a bullish move. The Fibonacci analysis has led to the establishment of three target prices at 1.618, 2.618, and 3.618 levels. If successfully breaks above 24$ and sustains trading above this level, it may pave the way for a short-term upward trend, with a target range extending up to ~$33.
I'm not a financial advisor, and the information I provide should not be considered as financial advice. Any decisions you make based on the information I give are your own responsibility. It's important to conduct your own research or consult with a qualified financial professional before making any financial decisions.


Chainlink Link price shows strong movement, what next target ? Last year, the Linkusdt price gave patient investors x3 growth .
After reaching our final goal of $17.50, the Link price did not plummet sharp, but stuck in the liquidity zone $12.50-17.50. This means that there is still interest in the Chainlink project and the Link coin.
So, we can assume that the growth of the Linkusd price will continue in the near future, at least to $21.60-22.30 , in our opinion.
But only time will tell what will happen in reality )
_____________________
Did you like our analysis? Leave a comment, like, and follow to get more

Will LINK Chain Up Further? Probing Supply & Demand for Bullish Hello Traders,
Critical Zone Breakout from Supply Zone Indicates Potential Upside Momentum,
We have 2 Supply Zones. If The Price Breached The Supply Zone, Take Entry While Retested and Looking For Bullish Momentum
Please Note That The Only Purpose of The Information On This Page is Purely Educational.
I Would Welcome Your Participation And Support in the Form of Likes, Comments, And Follow us to Offer Some Encouragement.
Thank You.


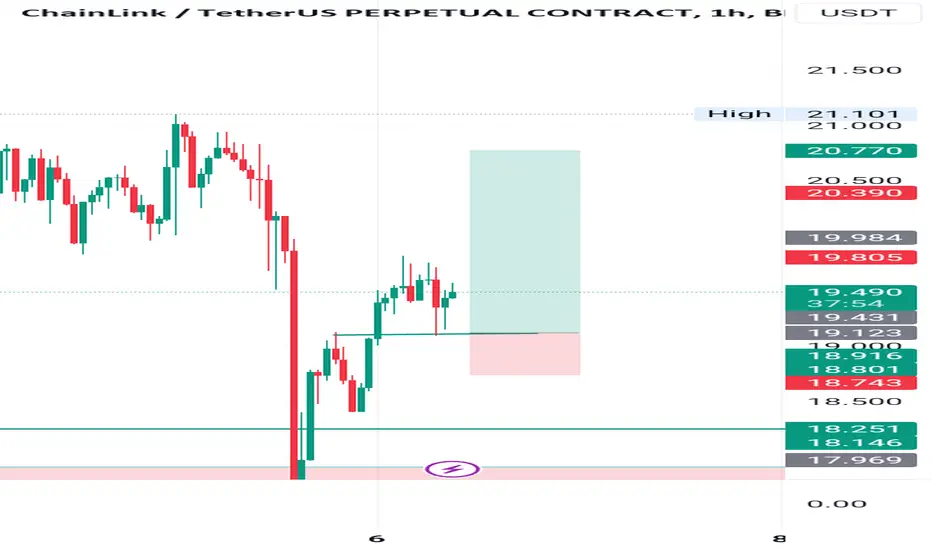
LINK: sell in breakeven📊Analysis by AhmadArz:
🔍Entry: 20.137
🛑Stop Loss: 20.29
🎯Take Profit: 20 - 19.90 - 19.77
🔗"Uncover new opportunities in the world of cryptocurrencies with AhmadArz.
💡Join us on TradingView and expand your investment knowledge with our five years of experience in financial markets."
🚀Please boost and💬 comment to share your thoughts with us!

Linkies 31024Link on breakout with coil for continuation towards 30. Swinging this one as a 30 level it can literally teleport there overnight. These straight up zones are no joke and in the bear market they work as straight down zones just the same. Look left always. Price action over everything. Have the diamond stones to see your trades come into fruition. Dont sell out right before it rips and into something that dips. Pick wisely

#LINK/USDT#LINK
On the 4-hour frame, we have an ascending channel, within which the price trades and adheres to its limits to a large extent
We have strong upward momentum that the price is expected to continue rising
We also have a higher stability moving average of 100
Entry price is 15.85
The first goal is 16.35
Second goal 17.32
Third goal 18.20

LinkPrimary and secondary counts.
No matter where, after a 3 wave pullback, chain link should prepare for a massive 3rd wave move.
And that is something that one shouldn't miss out on.
I wish i could say that it is already done, however the wave 5 (yellow ) wasnt as strong as i thought it would be or as it should be in crypto.
But it is 1:1 so it still stands as my primary count, that link has topped.
Alt count in white, provided, similar outcome after it, same idea, which is long term long and hold

LINK to 24 is a free Money After the BTC New ATH , Liquidity will be on ALTS
Link was lagging inside the Horizontal channel for some time now with that broke and Retest
nothing is pending
keep an eye on Link and dont miss that free money
Copy Spot trading are available now in bitget with 100 % win rate so far , seats are limited , lets make Money
BitcoinJumber

Chainlink(LINK): Will It Breakout or Breakdown?Chainlink has been in a nice bullish movement since February 24th, where we have also formed a higher-high zone.
With that being said, we are looking closer at that support zone, which we might test multiple times more. Breaking it would mean a good movement to lower zones, yet holding it with each touch would strengthen the potential bullish movement!
Swallow Team

CHAINLINK #LINKThere is a 4-hour order block that will likely drive the price higher, so I have taken a long position with a target of the 1-hour lower resistance.
LINK/USDT Perfect Bounce, Indicating Continue the Upward Move!💎 LINK has recently experienced notable market dynamics. After a strong rebound from the demand area, LINK is showing signs of potential upward continuation and attempting to break out of the ascending channel.
💎 If LINK successfully breaks the pattern, there's a probability of significant price movement, potentially reaching our target area.
💎 However, if LINK fails to break out of the pattern, there's a chance that the price will retreat to the demand area around $17.6, or even test the Bullish OB area in the range of $16 to $15.
💎LINK must bounce back when it reaches the Bullish OB area, indicating a resumption of upward momentum.
💎 However, if LINK breaks below the support trendline, coinciding with the Bullish OB area, it could signal a bearish trend reversal, potentially leading to continued downward movement.

Link Daily Chart Analsysis Link Daily Chart Analsysis
Once again beautiful setup
with little risk management cheers and boost

LINK Targeting topI expect a continuation of the trend on Chainlink. $20 acted as a good support zone and i think we will reach $22 before retracing back down

#LINKUSDT#LINKUSDT
BIST:LINK
Some intraday call for today
Expecting some bullish movement on this coin, expecting price to push to the $24.736 zone and above, you can enter a long and exit at the given price above, you SL should be below $19.460
#forex #forextrading #forexsignals #crypto #forexlifestyle #money #lifestyle #trade #stock #cash #iphone #daytrading #currencytrading #tradingonline #swingtrading #profit #forextips

LINKUSDTI bought at the price of 5.900 myself and have been holding it until now
Please review and enter in your own style

540% is our targetHello
As you see we have broken the trendline and the price is in battle with the tough resistant zone.
Spot trade.

LINK: Consolidation before vertical leap?Link is known for being the type of coin that likes to consolidate longer periods, and then - out of the blue - shoots up +250-300% within just few days.
I'm not trying to predict when this happens, but I'm betting on that happening again. Looking for link to get near $30 when we finally clear that 18-20 usd region.
That's just how LINK operates in bull runs and in trending markets.
Only thing that's needed now is patience.
NFA
Enjoy.

LINK: Weekly RSI Above 50 -> Potential for a Multi-Year Bull RunLooking back at Chainlink's price history, we find a compelling pattern. The last time Chainlink's weekly RSI crossed above the 50 mark, it marked the beginning of a multi-year bull run for the LINK token. During that period, Chainlink witnessed substantial price growth, establishing itself as a leading decentralized oracle network.
While this indicator alone should not be the sole basis for investment decisions, it serves as a valuable tool for traders and investors to monitor and consider alongside other fundamental and technical factors. As the crypto market continues to evolve, Chainlink's performance will be closely watched to see if history repeats itself with another extended period of bullish.
Personally I have significant multi-year spot exposure for LINK token. No stop loss since this is more of a investment than a single trade.

LINKUSDT on junction to freeway +30%LINKUSDT - 18.32 service stop ahead, then freeway to 21.66 (+30%)

Linkusdt Trading opportunityLet take a look at LINKUSDT, which is exhibiting a fascinating price behavior within two strong trendlines, signaling potential opportunities.
Price has been consolidating within two converging trendlines, forming a pattern that resembles both a falling wedge and an irregular triangle. This dual structure is quite intriguing, as both patterns can lead to significant price moves. The lower trendline has been acting as strong support, with the price consistently bouncing off of it. Meanwhile, the upper trendline is proving to be a formidable resistance level, which the price has struggled to breach.
Recently, the price made a bounce off the bottom trendline, suggesting that the next target could be the upside trendline. If the price can break through this resistance, it could lead to a substantial upside move. A successful break of the upside trendline could propel LINKUSDT towards the Major Supply Zone, offering traders an excellent opportunity for profit. However, it's important to wait for a confirmed breakout, as false breakouts can result in losses.
Keep in mind that this analysis is based on the current market conditions and should be used as guidance, not financial advice. Always do your own research, and make sure to manage risk accordingly.
Good luck, and happy trading!
