What's up with LINK?!(4H) (OVO)It like others has declined.Now has done a small correction.I believe It can continue the bearish and fall after correction
LINKUSDT trade ideas

LinkLink
Chainlink was created in 2017 by Sergey Nazarov and Steve Ellis, who co-authored a white paper introducing the Chainlink protocol and network with Cornell University professor Ari Juels the same year. Chainlink acts as a "bridge" between a blockchain and off-chain environments. The network, which services smart contracts, was formally launched in 2019.
In 2018, Chainlink integrated Town Crier, a trusted execution environment-based blockchain oracle that Juels also worked on. Town Crier connects the Ethereum blockchain with web sources that use HTTPS.
In 2020, Chainlink integrated DECO, a Cornell project co-created by Juels. DECO is described by its authors as a protocol that uses zero-knowledge proofs to allow users to prove information is true to a blockchain oracle without revealing sensitive information, such as birth dates. Chainlink published a second white paper in April 2021. That paper, Chainlink 2.0: Next Steps in the Evolution of Decentralized Oracle Networks, detailed a vision for expanding the role and capabilities of decentralized oracle networks to include hybrid smart contracts, which utilize on-chain code and off-chain services provided by oracle networks.


$LINK 6H Chart AnalysisBIST:LINK 6H Chart Analysis
LINK is retesting the breakout zone from the ascending triangle.
Price is holding above key support around $16.20.
A bounce here could ignite a move toward the $22.85 target.
- Entry: CMP
- TP: $22.85/ $19.23 / 21.32
- SL: $15.26
Bullish continuation likely if support holds!
DYRO, NFA

LINK/USDT is Nearing The UptrendHey Traders, in today's trading session we are monitoring LINK/USDT for a buying opportunity around 15.20 zone, LINK/USDT is trading in an uptrend and currently is in a correction phase in which it is approaching the trend at 15.20 support and resistance area.
Trade safe, Joe.

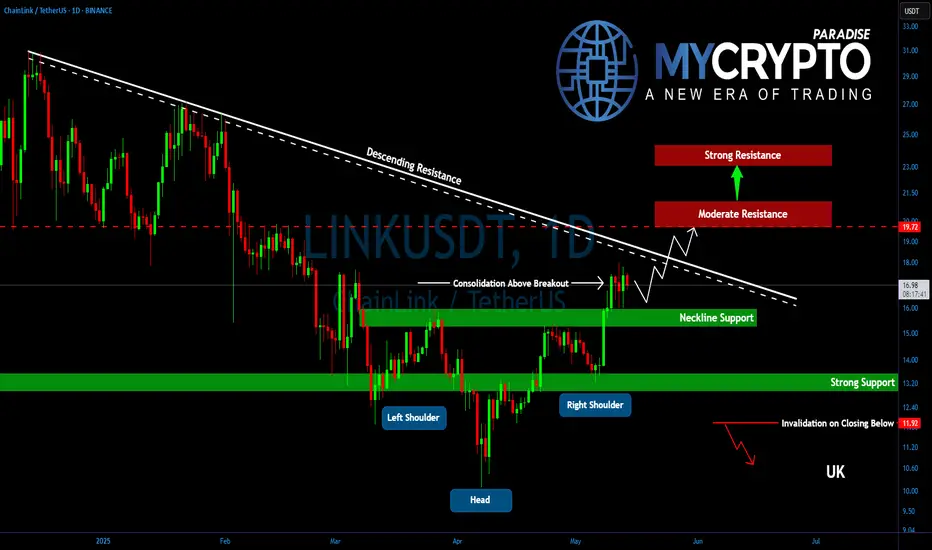
Is LINK Preparing for a Parabolic Rally? Key Levels to WatchYello, Paradisers! After completing its ABC correction, #LINK slipped into a sideways phase — but something significant is brewing beneath the surface. The recent formation of an inverse head and shoulders might be signaling the start of something much bigger.
💎LINK has now confirmed a breakout above the key neckline at $16.00, a critical level that had been capping price action. Following this breakout, the price is holding its ground well and entering a post-breakout consolidation that often acts as the launchpad for the next explosive leg.
💎#LINKUSDT now faces a decisive resistance at $18.50, a trendline rejection point that has held strong since December 2024. A clean break above this level could ignite strong bullish momentum. If bulls succeed, we could see LINK pushing quickly toward the $19.70–$20.30 range, a moderate resistance area, where partial profit-taking is likely from experienced hands.
💎Should momentum persist, the next major upside lies between $23.25–$24.00, the measured target of the inverse head and shoulders breakout. This zone is not just technically significant due to the pattern, it also aligns with the 61.8% Fibonacci retracement, making it a high-confluence resistance.
💎On the downside, LINK has strong support between $16.00–$15.50. This is not only the breakout neckline but also closely aligned with the 50 EMA and 200 EMA, reinforcing this range as a robust demand zone.
Paradisers, strive for consistency, not quick profits. Treat the market as a businessman, not as a gambler.
MyCryptoParadise
iFeel the success🌴
TradeCityPro | LINK: Eyeing Breakout as RSI Signals Divergence👋 to TradeCity Pro!
In this analysis, I’m going to review the LINK coin. This project is one of the well-known DeFi and Cross-Chain platforms, and it's considered one of the top projects in these categories.
🔍 The LINK token currently has a market cap of $627 million and holds a ranking on CoinMarketCap.
⏳ 4H Timeframe
As you can see, LINK has started a bullish leg, rising from $13.30 to $17.62. After a pullback that reached as low as $15.92, it has returned to test the previous high.
⚡️ If the $17.62 resistance is broken, the price could rally toward $19.42. Therefore, a breakout above $17.62 can be used as a long entry trigger.
📊 So far, volume has aligned well with the upward trend, and there are no signs of weakness from the volume perspective. However, if volume rises during a pullback or drops during a bullish move, it would signal a volume divergence, potentially indicating a trend reversal.
💥 Meanwhile, the RSI oscillator shows a bearish divergence. If RSI closes below the 50 level, this divergence would be confirmed, suggesting the possibility of a corrective move.
✨ To confirm a deeper correction or trend reversal, a breakdown below $15.92 would be significant. The next support after that lies at $15.22, with the main support far below at $13.30.
✔️ For short positions, I recommend waiting for clearer signs of trend reversal, such as volume divergence or confirmed RSI divergence. At the moment, there’s no solid short setup, and we need to wait for a suitable structure to develop.
📝 Final Thoughts
This analysis reflects our opinions and is not financial advice.
Share your thoughts in the comments, and don’t forget to share this analysis with your friends! ❤️

Analyzing the trading chart for the LINK/USD perpetual contractAnalyzing the trading chart for the LINK/USD perpetual contract on the Bitget exchange, we can derive some conclusions about the price movement in the short term and suggest trading strategies.
Chart Analysis
Current Price: The current price of LINK is 17.308 USDT, with a volume of 1.28 K contracts traded in the last hour. This indicates moderate trading activity.
Moving Averages:
50-period MA (red line): This moving average is positioned above the current price, suggesting potential resistance and a possible short-term correction.
200-period MA (green line): This moving average is also above the current price, further reinforcing the idea of resistance.
Indicators RSI and MACD:
RSI: With a value of 47.11, the RSI indicates a neutral market condition, suggesting no strong buying or selling signals at this time.
MACD: The MACD lines show some stability, with momentum signals not particularly strong in either direction.
Support and Resistance:
Horizontal lines on the chart indicate various support and resistance levels. The presence of annotations like "BOS" (Break of Structure) and "ChoCH" (Change of Character) suggests that there could be imminent trading opportunities based on price movements.
Trading References
Long Strategy: Consider taking a long position if the price breaks the resistance level around 17.40 USDT. An entry point in this case would be around 17.35 USDT.
Profit Target: Set a profit target at 17.80 USDT, where there are signs of historical resistance.
Stop Loss: Set a stop loss at about 17.00 USDT to limit losses in case of a trend reversal.
Short Strategy: If the price drops below 17.00 USDT, consider a short position.
Entry Point: Wait for confirmation below this level, for example, at 16.90 USDT.
Profit Target: A profit target could be set at 16.50 USDT.
Stop Loss: Set a stop loss at 17.20 USDT to manage risk.
Conclusion
In summary, the chart indicates a neutral market condition with potential movements both upward and downward. Technical indicators and moving averages show significant resistance, while the RSI and MACD do not signal overbought or oversold conditions. Therefore, it is advisable to closely monitor key price levels and adopt both long and short trading strategies based on future movements. Ensure to stay updated on market dynamics and adjust strategies accordingly.

LINK in coming Weeks ...The pattern has broken, and now I expect the price to rise to $36 . AB=CD.
previous analysis
Give me some energy !!
✨We spend hours finding potential opportunities and writing useful ideas, we would be happy if you support us.
Best regards CobraVanguard.💚
_ _ _ _ __ _ _ _ _ _ _ _ _ _ _ _ _ _ _ _ _ _ _ _ _ _ _ _ _ _ _ _
✅Thank you, and for more ideas, hit ❤️Like❤️ and 🌟Follow🌟!
⚠️Things can change...
The markets are always changing and even with all these signals, the market changes tend to be strong and fast!!

LINK/USDT Analysis: Trend bullish, breakout at 16.600 USDT. Support at 16.366. Entry at 16.600, stop-loss 16.350, take-profit 16.800/17.000. Monitor for volatility! #CryptoTrading #LINK

Daily down trend line just brokeOn the chart it is clear the daily candle is moving around my downward trend line meaning closing above it could lead us to new higher levels.
so here is my strategy for trade:
the price is moving into my base area trying to close above the daily trend line. if those conditions hold, then we can find proper entry for long position in lower time frames.
the first important level would be around 19.5$, breaking this level will lead us to upper levels. so if you eager to long this coin you can follow me and my next updates.
Enjoy the market

LINKUSDT | MONTHLY ANALYSIS
HTF BREAKDOWN :
Breaking down things from the start we have a sweap of the Prl while almost 1.5 years of Accumulation
before we saw a good Explansion to the Upside,
Price Currently Rejecting off the Monthly imbalance region that
was caused by the move higher so we can see a ltf (lower time frame) bearish trend getting acceptance off the Monthly Vwap + Bof ( Bullish Orderflow Region) where our dca bids are placed
DCA REGION
- 13.220
TARGETS
Strong Fundemetals,
Aiming for Long-term hold targets 52 - 73.20 - 81

LINKUSDT | Long Bias | Post-Spring Setup | (May 12, 2025)LINKUSDT | Long Bias | Post-Spring Setup + Money Flow Shift | (May 12, 2025)
1️⃣ Short Insight Summary:
Chainlink is completing a corrective phase after a strong three-wave move up. With money outflow showing on the lower timeframes, a pullback toward the $14 zone could offer a solid long re-entry.
2️⃣ Trade Parameters:
Bias: Long
Entry Zone: $14.00
Stop Loss: $12.74
TP1: $15.50
TP2: $69.84
Final TP: $126.26 (longer-term, if trend extends)
Partial Exits: Advised at each TP for safer profit booking, especially at early resistance points
3️⃣ Key Notes:
✅ Money is flowing out on the 1H and 4H charts, suggesting we’re nearing the end of a short-term correction.
✅ Structure looks like a spring setup—ideal for entering on weakness before the next bullish leg.
✅ Already took profits around $16.60 from earlier long exposure—this setup reflects a refined re-entry with lower risk.
✅ $14 zone is a key technical level; will act as a decision point for bulls if defended on volume and reaction.
❌ No reason to chase high entries right now—better to be patient and protect capital.
4️⃣ Optional Follow-up Note:
Will update the idea if LINK reacts sharply at $14 or if larger market shifts invalidate the bias.
Please LIKE 👍, FOLLOW ✅, SHARE 🙌 and COMMENT ✍ if you enjoy this idea! Also share your ideas and charts in the comments section below! This is best way to keep it relevant, support us, keep the content here free and allow the idea to reach as many people as possible.
Disclaimer: This is not financial advice. Always conduct your own research. This content may include enhancements made using AI.

Chainlink Price - 12/May/2025Chanilink price has broken the Equal High Zone at 17.5$. It will retest to Order block zone (15.4$ - 15.8$) and need to break EQH ( 17.5$) again, before it visit next Equal High at 19$ zone.
Keep our eye on it. Long term focus is 100$ per coin #Chanilink #Topdifi

Chainlink Analysis for Intraday TradingWait for the entries to be filled from both side, I will prefer short entry here, Reason btc looks too weak now, USDT.D has reached the strong bullish zone and can hit 4.80-4.89% zone for correction. While I will short BTC from 105-106K SL if 4 candle closes above 107.8K, at the same time I will open short positions on ETH, and Link SL when BTC hits the SL.

LINK/USDT 1W chart reviewHello everyone, let's look at the 1W link to USDT, in this situation we can see how the price is fighting for the mountain from the downward trend line over which we are currently.
Going further, let's check the places of potential target for the price:
T1 = $ 18.38
T2 = $ 21
Т3 = $ 23.53
Let's go to Stop-Loss now in case of further declines on the market:
SL1 = 15.31 $
SL2 = $ 13.17
SL3 = 10.53 $
Looking at the RSI indicator, we see a clear increase on the indicator and a return to the upper part of the range, but there is still room for continuing the ongoing strong growth.

POSSIPBLE BULL SET UP ON LINKUSDTLINK broke out of consolidation phase . IT also broke out of downward counter channel and 15.27 resistance level signaling a potential upward movement. If price eventually break out of the main channel ,the bullish trend will hold.

LINK to make a new ATH?LINK is showing great strength and respecting EW theory.
The ABC correction finished in JUNE-2023 and since then, LINK has likely finished its wave (1) and wave (2). Now in motion to complete its wave (3).
Big Question is whether LINK will break its previous ATH of $52.88?
If it goes key targets are $70-80 (wave 3), $90-120 (wave 5).
Could it be that LINK becomes one of the strategic reserve assets for the US? Time will tell.

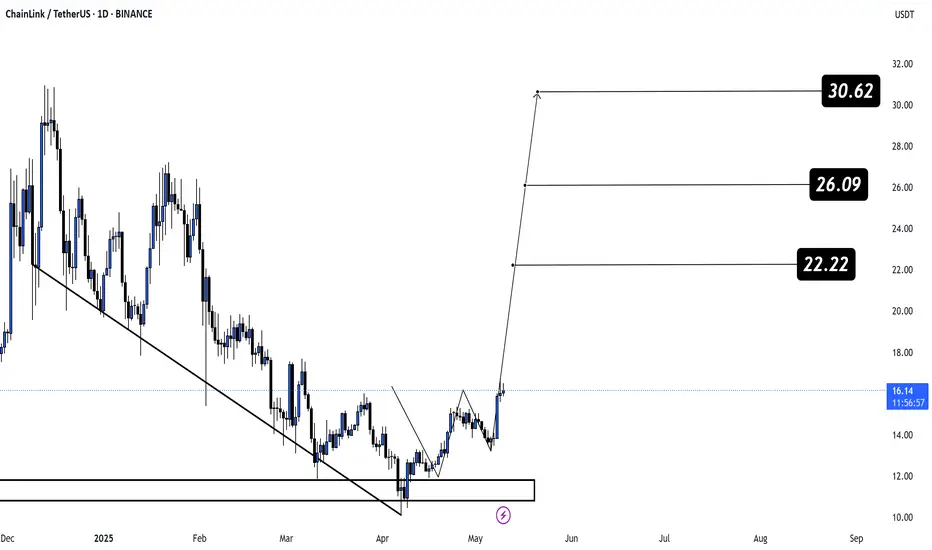
LINK — Time to Load Up!
CRYPTOCAP:LINK has just confirmed a bullish inverse Head & Shoulders breakout and smashed through the crucial $15.5 resistance — the strongest price level since late 2024!💥
This breakout unlocks massive upside potential:
🎯 Target 1: $22.22
🎯 Target 2: $26.09
🎯 Target 3: $30.62
Technicals are aligning for a major trend reversal, and the breakout signals the start of a possible multi-week rally. 🔓📈
Chainlink (LINK) Update (12H) – Bullish Structure StrengthensIn our previous analysis, I outlined multiple technical reasons suggesting that LINK was preparing for a major bullish phase. Since then, LINK has surged over 25% from the level I initially highlighted.
Upon reassessing the chart from a broader perspective, I’ve identified a reversed Head and Shoulders pattern forming on the higher timeframes — a classic bullish reversal signal. This has also prompted a revision of the Elliott Wave count on the macro structure.
Updated Technical Insights:
Wave Count: LINK is currently in Wave 3 of a larger bullish impulse, based on Elliott Wave Theory.
Breakout Confirmation: The neckline of the reversed Head and Shoulders pattern is being breached, which aligns with the 1.618 Fibonacci extension — a typical target zone for Wave 3.
If you entered based on the prior setup, you’re likely sitting on a 20–25% gain even on a 1x position. There’s no need to add or chase the price at this point — the optimal move is to secure profits by moving stop-loss to break-even and continue managing your position with discipline.
Updated Target:
The mid-term projection for LINK now stands around the $25 mark.
— Thanks for reading.

$LINK just broke out CRYPTOCAP:LINK just broke out of its downtrend and 100-day SMA!
Bullish reversal confirmed eyes on $30 +86%.
Entry: CMP
- TP1: $18.90
- TP2: $23.50
- TP3: $29.90
Stop Loss: $14.80
Use 3–5x leverage max. DYOR, NFA.

LINK Broading wedged Currently it comes out of this support zone. Maybe this support block you can consider to start buying back from here with a short -term target of at least 10%+.

LINKIm waiting again for confirmation on this trade, my entry lies on a 30m order, why? because the same zone use to be a resistance hence why the orderblock is valid.
