LINKUSDAccording to previous analysis and monitoring of this currency for a long time, the probability that the price has started its upward trend is high and our team will be a buyer with any decline in this currency for high targets (the ceiling of the descending channel).
LINKUSDT trade ideas

LINK/USDT: Strong Momentum Points to Higher TargetsThe LINK/USDT pair has shown strong bullish momentum on the 1-hour timeframe, breaking above both the 15.00 level and a downward trendline. On the daily chart, four consecutive bullish candles reflect persistent buying pressure.
Recent movements suggest an ABC pattern is unfolding, hinting at a potential push toward the 17.00 resistance level. With momentum building, the market may soon test this zone, barring any negative news that could prompt a sell-off. A pullback may occur short term, but the overall outlook remains bullish, with a mid-term target at the resistance zone around 16.45

LINKLINK
March 26, 2025
8:02 AM
CRYPTOCAP:LINK just had a clean bounce off the +W OB (not a full-on impulsive move, but definitely a solid reaction)
Also, the MA100 and MA200 are forming a golden cross on both weekly and 4H TF — pretty bullish signal overall.
Looks like we’re setting up for W3. Right now, we’re in W2 and potentially about to enter W3 of W3, which is usually the strongest leg.

Lingrid | LINKUSDT short-term BULLISH Momentum in the MARKETThe price perfectly fulfilled my previous idea . It hit the target level. BINANCE:LINKUSDT has gained upward momentum on the 1H timeframe, surging above the 15.00 level and downward trendline. On the daily timeframe, we see a series of four consecutive bullish candles, indicating strong buying pressure. Recent price action suggests the formation of ABC signals, implying that the market is positioning itself for an upward move towards the next resistance level around 17.00. As momentum builds, it is likely to test this key level, which could lead to further price increases unless sudden negative news triggers sell offs. Overall, I expect a pullback followed by a continuation move. My goal is the resistance zone around 16.45
Traders, If you liked this educational post🎓, give it a boost 🚀 and drop a comment 📣

LINK Trade Setup - Higher Low ConfirmationLINK is showing early signs of reversal from a key higher timeframe support zone. We anticipate a short-term dip into the buy zone before shifting into an expansion phase.
🛠 Trade Details:
Entry: $13 – $14 (Buy Zone)
Take Profit Targets:
$17.00 - $17.70 (Initial Resistance)
$21.70 - $22.40 (Breakout Target)
Stop Loss: Daily close below $12
Looking for higher low confirmation before the move up. 📈🚀

Chainlink Set for 100% Surge Amidst Strategic Partnership The Price of Chainlink ( CRYPTOCAP:LINK ) is set for a comeback with a potential 100% surge in sight- amidst striking a potential partnership with the Abu Dhabi Global Market (ADGM).
The asset is currently depicting multiple signs of a bullish renaissance with the daily price chart hinting at a bullish symmetrical triangle. Similarly, the daily Relative Strength Index (RSI) is at 52 hinting at a potential bullish surge incoming coupled with the falling wedge depicted in the chart.
Chainlink ( CRYPTOCAP:LINK ) entered into a strategic partnership with the Abu Dhabi Global Market (ADGM) to promote tokenization in the UAE. As part of the collaboration, Chainlink and ADGM have signed an MoU to create a secure and legally sound environment for asset tokenization in financial markets.
Significantly, ADGM will provide regulatory guidance, frameworks for secure tokenization, and expertise in asset tokenization. At the same time, Chainlink will contribute its technical expertise, blockchain-based solutions, and tokenization infrastructure.
What Is Chainlink (LINK)?
Founded in 2017, Chainlink is a blockchain abstraction layer that enables universally connected smart contracts. Through a decentralized oracle network, Chainlink allows blockchains to securely interact with external data feeds, events and payment methods, providing the critical off-chain information needed by complex smart contracts to become the dominant form of digital agreement.
Chainlink Price Live Data
The live Chainlink price today is $15.47 USD with a 24-hour trading volume of $326,378,851 USD. Chainlink is up 2.47% in the last 24 hours, with a live market cap of $10,167,634,903 USD. It has a circulating supply of 657,099,970 LINK coins and the max. supply is not available.

Smart Money Is Loading LINK — Are You Late Already ? Hello Traders 🐺
As you know, I'm one of the biggest LINK bulls in the universe—but why? 🤔
If you've been following me, you already know Altcoin Season is coming, and what smart money does is pretty simple:
✅ Invest in solid, high-quality projects
✅ Track whale activity and institutional movements
📊 But how do we do that? Let me break it down:
In my last idea about LINK/ETH, I showed you a chart revealing that LINK is gaining strength against both BTC and ETH. Here's what you should know:
🔹 1. LINK/BTC Chart: Near All-Time Lows
Despite LINK being around $15 in USDT terms, the LINK/BTC chart is close to its all-time low. That means:
📈 When Altseason kicks in, and LINK returns to its ATH vs BTC, the price could hit $160 per coin — a 10x gain! 💥
Even if LINK only hits half of that previous ATH, we’re still looking at $80 LINK — that’s huge upside! 🚀
🔹 2. LINK/ETH Chart: Stronger Setup
The same story exists on the LINK/ETH chart, but this one’s a bit more complex. I’ve already posted an idea about this setup—you’ll find it linked to this post.
Right now, LINK is trying to outperform ETH, and that’s important. Why?
Because if ETH moves up 10%, LINK could jump 18%+ thanks to this strength. 📊⚡
🔍 This post focuses on the immediate short-term setup. My mid-term outlook is still being finalized—because, honestly, it’s a bit tricky to explain unless you're a pro. (No offense—I know most of my audience are pro traders 😎)
So let me expose that setup at the right moment. Until then, make sure to follow so you don’t miss my next updates! 📢🔥
Thank you for your support, my awesome audience 🙏💙
🐺 Discipline is rarely enjoyable, but almost always profitable 🐺
🐺 KIU_COIN 🐺

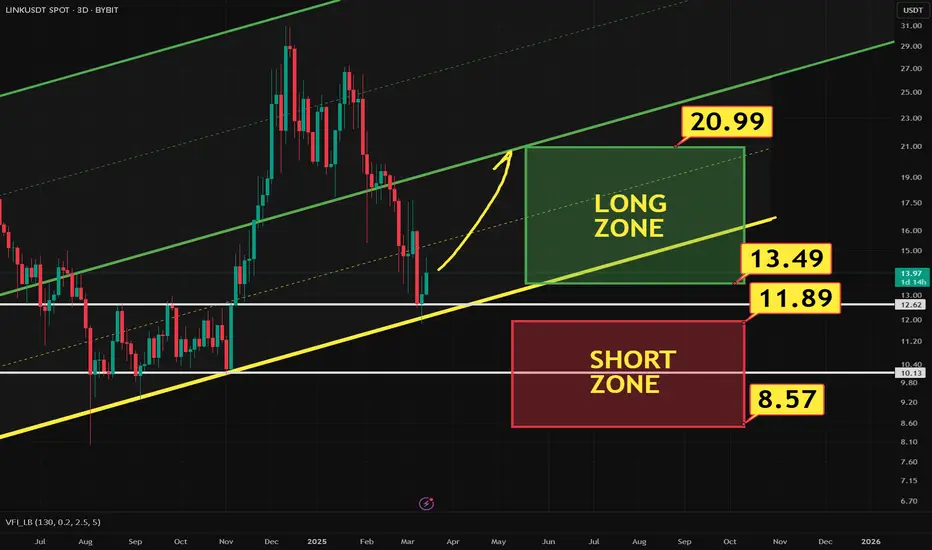
LINK at a crossroadsIt is a very suitable coin for both long and short positions. There are two channels. It is debatable whether it can be as strong as its old bull. But here's how to make money. not investment advice
LINK/USDT Rebound: Is This the Start of a Bullish Leg?Chainlink is currently respecting a well-established ascending support trendline, which has held firm for several years. The price has recently bounced off this trendline once again, indicating strong buyer interest at this dynamic support level.
The Stochastic RSI is coming out of the oversold region, suggesting a potential bullish reversal is in play.
If this momentum continues, the next key area to watch is the resistance zone near the $30–$35 range. A clean break above this zone could signal a strong continuation of the long-term uptrend.
However, if the trendline breaks, LINK may revisit the key horizontal support zone around $5–$6

LINK BULL MarketHolding the Chainlink (LINK) cryptocurrency can be appealing for several reasons:
1. Key Role in the Blockchain Ecosystem:
Chainlink provides a decentralized oracle network that allows smart contracts to access verified real-world data. This is essential for the proper functioning of many blockchain applications.
2. Growing Adoption and Strategic Partnerships:
The project has established partnerships with major financial institutions like Swift and Microsoft, acting as a bridge between traditional finance and blockchain technology.
3. Innovation and Technological Advancements:
Chainlink is integrating artificial intelligence and focusing on decentralized identity and blockchain interoperability, strengthening its position as a leader in decentralized solutions.
These factors suggest that holding LINK could be appealing to those who believe in the future growth and importance of decentralized technologies.
you have to believe in the power :)
BINANCE:LINKUSDT

Chainlink ($LINK) Weekly Chart Outlook
CRYPTOCAP:LINK is trading within a clear rising wedge structure and has just bounced from the 0.786 Fibonacci level ($13.55) — a historically strong retracement zone.
This bounce aligns perfectly with the lower trendline support, suggesting a potential continuation to the upside. If this trend holds, we may witness a strong bullish leg ahead.
Bullish Targets :
Target 1: $25.80
Target 2: $32.66
Target 3: $40.70 (upper wedge resistance zone)
📍 Entry Zone: $13.50–$15.50 (current bounce area)

The key is whether it can be supported around 15.45
Hello, traders.
If you "Follow", you can always get new information quickly.
Please click "Boost" as well.
Have a nice day today.
-------------------------------------
(LINKUSDT 1D chart)
How to interpret the OBV indicator
1. If OBV is rising from the 0 point, it is interpreted as an increase in buying power, and if it is falling, it is interpreted as an increase in selling power
2. How to create an EMA indicator for OBV and interpret it as rising or falling above the EMA indicator
3. How to add the price channel formula to the OBV indicator and interpret it like Bollinger Bands
-
If the price is maintained at the current price position, it is expected to attempt to rise above 15.45.
However, since the StochRSI indicator is showing a downward trend in the overbought zone, the key point is whether there is support near 15.45.
If it fails to rise, we should check whether there is support near 13.13.
-
I think we are facing a golden opportunity to turn into an upward trend.
If it fails to turn into an upward trend this time, there is a possibility that it will eventually fall to around 10.0, so we should think about a response plan for this.
Therefore, what we should pay close attention to is whether there is support near 15.45 and it can rise.
If support is confirmed near 15.45, it is the time to buy.
The first sell zone is 19.52-20.51.
-
Thank you for reading to the end.
I hope you have a successful transaction.
--------------------------------------------------
- Big picture
I used TradingView's INDEX chart to check the entire range of BTC.
(BTCUSD 12M chart)
Looking at the big picture, it seems to have been maintaining an upward trend following a pattern since 2015.
In other words, it is a pattern that maintains a 3-year upward trend and faces a 1-year downward trend.
Accordingly, the upward trend is expected to continue until 2025.
-
(LOG chart)
Looking at the LOG chart, you can see that the upward trend is decreasing.
Accordingly, the 46K-48K range is expected to be a very important support and resistance range from a long-term perspective.
Therefore, I expect that we will not see prices below 44K-48K in the future.
-
The Fibonacci ratio on the left is the Fibonacci ratio of the uptrend that started in 2015.
That is, the Fibonacci ratio of the first wave of the uptrend.
The Fibonacci ratio on the right is the Fibonacci ratio of the uptrend that started in 2019.
Therefore, this Fibonacci ratio is expected to be used until 2026.
-
No matter what anyone says, the chart has already been created and is already moving.
It is up to you how to view and respond to it.
Since there is no support or resistance point when the ATH is updated, the Fibonacci ratio can be appropriately utilized.
However, although the Fibonacci ratio is useful for chart analysis, it is ambiguous to use it as a support and resistance role.
The reason is that the user must directly select the important selection points required to create the Fibonacci.
Therefore, it can be useful for chart analysis because it is expressed differently depending on how the user specifies the selection point, but it can be seen as ambiguous for use in trading strategies.
1st: 44234.54
2nd: 61383.23
3rd: 89126.41
101875.70-106275.10 (when overshooting)
4th: 134018.28
151166.97-157451.83 (when overshooting)
5th: 178910.15
-----------------

LINKUSDT 1WThe price, while in an uptrend, has reached the support level at the bottom of the ascending channel. In terms of price action, I do not anticipate any further significant correction beyond this point. From a temporal perspective, I am considering the period from April 25 to May 25—a one-month span—as the timeframe for the bottom formation. Conditions within this defined area and timeframe appear to be conducive to a solid upward rally.

LINKUSDT OB+FVG+SSL long trade setupLink is already in a bullish trend, did bullish BOS. We have found OB+FVG+SSL area to enter in long trade. As marked on the chart.

Cup of tea of Chailink I decided to post a chart of my worldwide world favorite pair, Chainlink.
I see a cup and and handle pattern.
Long
Entry 14.7
Stop Loss 6
Take Profit 55

LINK/USDT 1H: Bullish Breakout – Targeting $15.45LINK/USDT 1H: Bullish Breakout – Targeting $15.45?
🚀 Follow me on TradingView if you respect our charts! 📈 Daily updates!
Current Market Conditions (Confidence: 9/10):
Price at $14.77, confirming a strong breakout above resistance.
RSI at 66.12, signaling bullish momentum with room to push higher.
Clear market maker accumulation pattern, supporting a continued uptrend.
Hidden bullish divergence on RSI vs price, reinforcing strength in the move.
LONG Trade Setup:
Entry: $14.70 - $14.77 zone.
Targets:
T1: $15.20 (first resistance).
T2: $15.45 (extended liquidity target).
Stop Loss: $14.20 (below recent support).
Risk Score:
8/10 – Strong structure but requires follow-through above $15.20.
Market Maker Activity:
Accumulation phase is complete, marked by a clean breakout above $14.60.
Strong support established at $14.20, reinforcing a high-probability long setup.
Minimal overhead resistance until $15.20, increasing the likelihood of a sustained move higher.
Recommendation:
Long positions remain favorable within the $14.70 - $14.77 entry range.
Monitor price action at $15.20, as this level may lead to a temporary pause or consolidation.
If volume continues to increase, expect a move toward $15.45.
🚀 Follow me on TradingView if you respect our charts! 📈 Daily updates!

LINKUSDT: Trend in daily time framePlease pay special attention to the accurate trend, and very accurate colored levels
Be careful, because the setup is very very sensitive
Don't get a position without SL.
BEST
MT
$LINK uptrend chLINK is in a strong ascending channel on the weekly timeframe, aligning with the 200 EMA.
If it confirms support, it could be a good buying opportunity.
Keep it on your watchlist!

LINK Setup: Breakout Play or Breakdown Risk?LINK is in a local uptrend, pressing against the 13.66 level. A breakout should trigger a swift reaction and push higher 13.99-14.55 looks like a very realistic target.
On the downside, 11.85 remains the key support. If bears step in aggressively and break the lows, we could see a fast drop toward 11.68-11.19.
Long on a breakout above 13.66.
TP: 13.99/14.2/14.55
Short if 11.85 fails.
TP: 11.68/11.5/11

LINK Ready for PUMP or what ?Do you think this will happen, or do you see LINK below $10 in the future?
Give me some energy !!
✨We spend hours finding potential opportunities and writing useful ideas, we would be happy if you support us.
Best regards CobraVanguard.💚
_ _ _ _ __ _ _ _ _ _ _ _ _ _ _ _ _ _ _ _ _ _ _ _ _ _ _ _ _ _ _ _
✅Thank you, and for more ideas, hit ❤️Like❤️ and 🌟Follow🌟!
⚠️Things can change...
The markets are always changing and even with all these signals, the market changes tend to be strong and fast!!

LINK CorrectionLINK is correcting the impulsive wave which began last September, and this correction could be in its final stages.
Blue 5 / Black C is beginning to show divergence, which is a bullish indicator. But remember you don't trade divergence by itself. There is still no higher high and price has to face 2 hurdles:
Green descending trendline
Strong gray resistance just below $20
I'll be keeping an eye for reversal patterns.

LINK at the top of the Volume gap. Will it hold? LINK needs to provide some data suggesting a reversal here. There is some support here however a volume gap below that would allow the price to fall right through. A choch would provide the evidence that we need.
Full TA: Link in the BIO

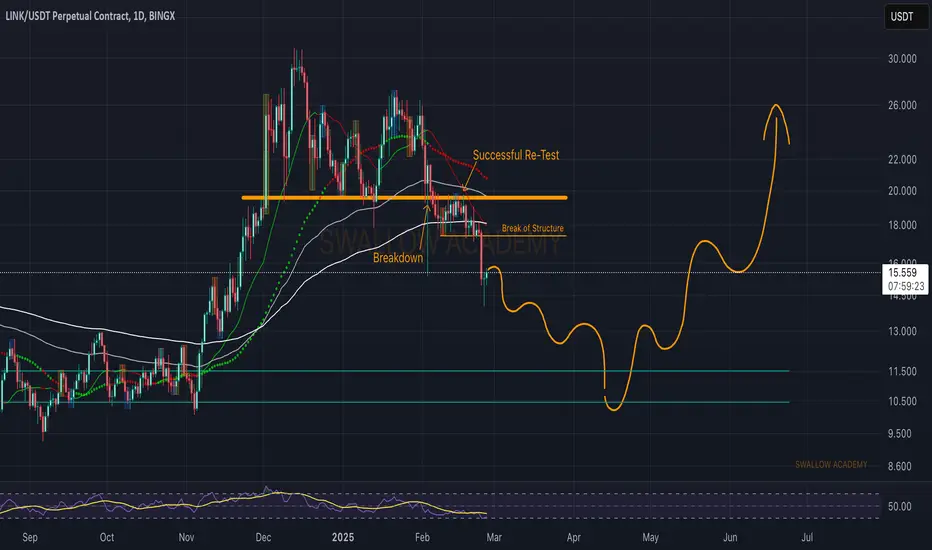
Chainlink (LINK): Perfect Breakdown and Successful Re-TestRecently we had a good breakdown and a healthy one, which later on resulted in our first BOS.
We are seeing a further drop on Chainlink coin to happen as now sellers too are over the 200EMA and continuing to show dominance. To see some buying volume, we first need some prime zone to bounce from (the green zone below).
Swallow Team