Chainlink - Preparing for trend reversalBINANCE:LINKUSDT (1D CHART) Technical Analysis Update
LINK is currently trading at $16.39 and currently we are seeing trend reversal and heading towards breakout from the bearish trend, if the price continues the bullish momentum we expect a clear breakout and bullish start of the bullish trend.
Entry level: $ Enter after breakout 18
Stop Loss Level: $14
TakeProfit 1: $ 20
TakeProfit 2: $ 22
TakeProfit 3: $ 26
TakeProfit 4: $ 30
TakeProfit 5: $ 35
Max Leverage: 2x
Position Size: 1% of capital
Remember to set your stop loss.
Follow our TradingView account for more technical analysis updates. | Like, share, and comment your thoughts.
Cheers
GreenCrypto
LINKUST trade ideas

$LINK Chainlink 55% Retracement ... Ready for Higher?CRYPTOCAP:LINK Chainlink Link has committed a 55% retracement after superbuy signal, from a height of approximately $30
Current Price: $14.7
Price action is forming a Falling Channel and Bullish Divergence Spotted also
Expecting a retest of previous supports - now resistances at 19.9, 25.9. 30.4
Invalidation is at under 13.5

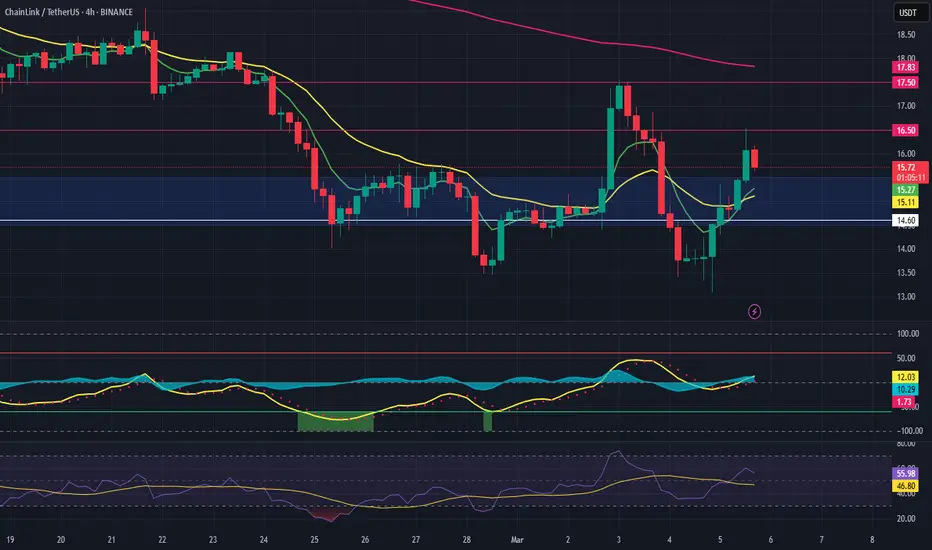
LINK Long OpportunityMarket Context:
LINK is currently testing the range's high support level at $15.30. A break and hold above this level could present a strong long opportunity for further upside.
Trade Details:
Entry Zone: $15.30
Take Profit Targets:
$16.50
$17.50
Stop Loss: Just below $14.60
This trade setup focuses on confirmation of strength at support, aiming for higher targets if the breakout sustains. 🔥
The Bull Market Is Just Starting For Chainlink LINKHello, Skyrexians!
During this bull run the best performance has been showed by the old high cap coins, BINANCE:LINKUSDT is not an exception. It had a textbook accumulation and then growth for 5x+ from the bottom. Is it enough or the main gains ahead.
Let's take a look at the weekly time frame. The first wave from the bull run start we can count as a wave 1. Then retracement has happened in the wave 2 and currently asset is forming wave 3. Looks like now price is finishing the wave 2 inside the larger wave 3. It would be better to see the green dot on the Bullish/Bearish Reversal Bar Indicator like we have seen previously, but the zone is already great to buy this asset. Target is located between 1 and 1.61 Fibonacci extensions which corresponds the price range between $40 and $50.
Best regards,
Skyrexio Team
___________________________________________________________
Please, boost this article and subscribe our page if you like analysis!

LINKUSDTEverything went according to the previous analysis, and demand appeared from the first zone at $14.
If this liquidity inflow is not just a pullback to the $17.5 level—which, given the momentum and demand structure from the channel bottom, I doubt it is—then we can follow the price up to the channel top or the $23 level.

LINKUSD NEXT MOVESell after bearish candle stick pattern, buy after bullish candle stick pattern....
Best bullish pattern , engulfing candle or green hammer
Best bearish pattern , engulfing candle or red shooting star
NOTE: IF YOU CAN'T SEE ANY OF TOP PATTERN IN THE ZONE DO NOT ENTER
Stop lost before pattern
R/R %1/%3
Trade in 5 Min Timeframe, use signals for scalping

Chainlink long back to $15.33I just recently opened a long trade on Chainlink. I believe it will break up soon and rest $15.33 area before continuing down again.
Though before it breaks up I think it could also correct backdown to $14.5 again for a minor pullback but didn't want to risk missing the move so entered, I think my stop is sufficient to facilitate the pullback if happens.

LINKUSD NEXT MOVESell after bearish candle stick pattern, buy after bullish candle stick pattern....
Best bullish pattern , engulfing candle or green hammer
Best bearish pattern , engulfing candle or red shooting star
NOTE: IF YOU CAN'T SEE ANY OF TOP PATTERN IN THE ZONE DO NOT ENTER
Stop lost before pattern
R/R %1/%3
Trade in 5 Min Timeframe, use signals for scalping

LINKUSDT 1WLINK ~ 1W Analysis
#LINK Buy gradually from here if you still have a Conviction on this coin with a short -term target of at least 20%+.

LINK SCALP SHORTTrying out a new strategy where the price breaks below the EMA on the 1h - 2h TF with a fill into a bearish LTF FVG and a break of structure on the 1H. SL and TP is seen on chart. GL!

Chainlink Fractal Price Pattern Dynamics & Bullish Growth Pot...Right now I am going to describe the conditions for LINKUSDT and the same analysis that is true for this pair is also true for most of the Altcoins market. The market is one.
Chainlink (LINKUSDT) produced a rising-wave in late 2024 and later a correction. This is also true for the rest of the Altcoins market. The correction is coming to an end producing a higher low compared to August 2024.
In mid-2024 (left side of the chart), we can see how a down-wave leads to a sideways market. This is the main condition that is now sure to develop. The sideways market of course is the period of accumulation, where the bulls accumulate strong in order to produce a new series of bullish waves. We know the next move is bullish because of the long-term higher low. The low in early 2025 is higher than the low in mid-2024.
This can be described as a simple 1,2,3 steps pattern.
1) The decline. This decline can be strong, long or short, steep or soft. Allow for wide variations across the market.
2) Sideways. This is the period where buyers accumulate at low prices before the next cycle starts.
3) The bullish wave. In this case, the next bullish wave is actually the 2025 bull-market. So instead of a simple bullish wave we will see massive growth ending with a bull-run phase in late 2025.
Ok. Present day. We have the decline which started in mid-December 2024. This decline is leading to step #2 which is the sideways action. Out of this sideways (consolidation channel) we will see a new bull-market develop.
Simple? Buy and hold.
Good things will happen to those that decide to buy Crypto.
Great things coming for those who decide to follow.
Thanks a lot for your continued support.
Namaste.

Chainlink ($LINK)
BIST:LINK has found strong support at the 0.786 Fibonacci retracement level and is bouncing back from the demand zone 📈.
The price is attempting to break out from the descending trendline, which could signal the start of a new bullish wave 🚀.
If confirmed, potential targets to watch:
🎯 Target : $35


LINK Long Opportunity Market Context:
LINK has retraced into a key support area, presenting a solid risk-to-reward opportunity for a potential move higher.
Trade Details:
Entry Zone: $14.50 - $15.50
Take Profit Targets:
$17.20
$19.50 - $21.50
$27.00 - $30.00
Stop Loss: Just below $13
This setup anticipates buyers stepping in at support, with the potential for upside continuation if momentum builds. 🔥

LINK is Bullish now & many Traders don't see it !!Because of politics and misleading news, we are now witnessing these prices, and this caused most of my analyses to be wrong and not go according to my thoughts. However, now the price has a strong support area that if it reacts to it, the price will go up to $19 and create a V pattern. Since this market is filled with some politicians and some Persons & their misleading promises, maybe the price will drop again and go down to $13 and then grow again.
Give me some energy !!
✨We spend hours finding potential opportunities and writing useful ideas, we would be happy if you support us.
Best regards CobraVanguard.💚
_ _ _ _ __ _ _ _ _ _ _ _ _ _ _ _ _ _ _ _ _ _ _ _ _ _ _ _ _ _ _ _
✅Thank you, and for more ideas, hit ❤️Like❤️ and 🌟Follow🌟!
❗Disclaimer
⚠️Things can change...
The markets are always changing and even with all these signals, the market changes tend to be strong and fast!!

LINK - Wait For The Bulls!Hello TradingView Family / Fellow Traders. This is Richard, also known as theSignalyst.
📈LINK has been in a correction phase trading within the falling blue channel and it is currently retesting the lower bound of it.
Moreover, the blue zone is a strong structure and round number $15.
🏹 Thus, the highlighted blue circle is a strong area to look for buy setups as it is the intersection of structure and lower orange trendline acting as a non-horizontal support.
📚 As per my trading style:
As #LINK approaches the blue circle, I will be looking for bullish reversal setups (like a double bottom pattern, trendline break , and so on...)
📚 Always follow your trading plan regarding entry, risk management, and trade management.
Good luck!
All Strategies Are Good; If Managed Properly!
~Rich

Chainlink Under Pressure – Breakdown or Fakeout?LINK has broken below a key support level and is now retesting it as resistance, indicating a potential continuation of the downtrend.
The current setup suggests a bearish bias with a favorable risk-to-reward ratio.
DYOR, NFA

Can #LINK Bulls Make a Comeback or Not? Bears Still in ControlYello, Paradisers! Is #LINKUSDT About to Break Down, or Will Bulls Defend This Critical Support? Let's discuss the latest analysis setup of #Chainlink:
💎#LINK is at a critical decision point, trapped inside a descending channel that has dictated price action for months. The question is—will it finally break out, or are we heading for another major leg down?
💎#LINKUSD is testing a crucial support zone around $14.00-$14.50, a level that previously acted as resistance and has now flipped into support. Losing this area could send the price tumbling toward the next major support at $8.08 and give bears total control.
💎The descending resistance line has been rejecting every bullish attempt, keeping #LINK in a downtrend. For a trend reversal, #LINK must break above $19.63, which would invalidate the bearish setup and open the doors for a strong rally toward $24-$26.
💎Bullish divergence spotted on the MACD suggests that a short-term relief rally could occur. However, unless we see a confirmed breakout, any upside movement might be just a temporary bounce before further downside.
Stay focused, patient, and disciplined, Paradisers🥂
MyCryptoParadise
iFeel the success🌴

LINK Mid TermChainlink (LINK/USDT) Summary Analysis
• Support Zone: $16.00 - $12.64 USDT (strong demand area).
• Resistance Levels: $24.12 USDT (first target) and $35.40 USDT (main target).
• Channel Structure: Price is near the lower band of a descending parallel channel, indicating a potential reversal signal.
Scenarios:
✅ Bullish Scenario: If LINK bounces from $16.00 USDT, targets are $24.12 USDT and $35.40 USDT.
❌ Bearish Scenario: A close below $16.00 USDT could trigger a drop to $12.64 USDT.
Strategy:
🔹 Entry: Buy within the $16.00 - $18.00 USDT range, with a stop loss below $12.64 USDT.
🔹 Breakout: A breakout above $24.12 USDT presents a buying opportunity.
🔹 Sell: A close below $16.00 USDT may accelerate the downtrend.
If the channel breaks out, LINK has significant upside potential. 🚀

LINK/USDT 1H: Bearish Momentum – Short Setup Targeting $15.80?LINK/USDT 1H: Bearish Momentum – Short Setup Targeting $15.80?
🚀 Follow me on TradingView if you respect our charts! 📈 Daily updates!
Current Market Structure:
Price at $16.03 with strong bearish momentum, having broken multiple support levels.
Clear bearish structure with a bearish breaker formed at $17.20 and multiple BOS confirmations.
Market Maker Activity:
Distribution phase is in effect, with market makers likely targeting $15.80 support.
Technical Indicators:
RSI is oversold at 26.51, yet momentum remains bearish.
No hidden divergence visible on the current timeframe.
Key Levels:
Resistance: $16.80 (previous support turned resistance).
Support: $15.80 (next major support level).
Trade Setup (Confidence 8/10):
Entry:
Look for a relief bounce in the $16.20-$16.40 zone.
Targets:
T1: $15.80
T2: $15.40
Stop Loss: $16.85 (above the recent breaker).
Risk Score:
7/10 – High volatility environment but with a favorable risk-to-reward if key levels hold.
Recommendation:
Wait for confirmation of a bounce in the $16.20-$16.40 range before entering the short position.
Given the oversold conditions and distribution phase, avoid chasing the current move.
Monitor price action closely as the downtrend continues toward the $15.80 support.
🚀 Follow me on TradingView if you respect our charts! 📈 Daily updates!

#LINKUSDT_DGiven the possibility of completing the WXY pattern at the $14 price range and its overlap with the weekly MEF, we can hope for the start of an uptrend to reach targets above $50.

LINK LONG SETUP ENTRY : 12.962
PROFIT : 18.080
STOP : 11.925
ALL trading ideas have entry point + stop loss + take profit + Risk level.
hello Traders, here is the full analysis for this pair, let me know in the comment section below if you have any questions, the entry will be taken only if all rules of the strategies will be satisfied. I suggest you keep this pair on your watchlist and see if the rules of your strategy are satisfied. Please also refer to the Important Risk Notice linked below.
Disclaimer

Univers Of signals| Deep Search: In-Depth Of LINKIn the daily timeframe, let’s examine the price movement in more detail. There was an Accumulation Zone between $9.77 and $12.88. After breaking $12.88 and pulling back, the next bullish leg began, pushing the price up to $29.21—a significant resistance area where the price was rejected and entered a corrective phase.
✨ In the first corrective phase, the price moved down to the 0.382 Fibonacci level and, failing to set a new high beyond $29.21, broke lower beyond the 0.382 area. It is now at the 0.5 Fibonacci level.
🧩 Essentially, a price range box has been formed between the 0.5 and 0.382 Fibonacci levels. A break below this range could lead to further corrections, with the 0.618 Fibonacci level and the crucial $12.88 level as subsequent targets. If the price reaches $12.88, it would fully correct the entire bullish leg, signaling the end of the uptrend.
🔽 The critical trigger for entering a strong bearish momentum in this position would be a break below 34.49 in the RSI. If both this support and the 0.5 Fibonacci support are broken, it could lead to significant market panic.
👀 Conversely, if the price can rise above the 0.382 Fibonacci level and start a new bullish leg, breaking $29.21 could provide an excellent opportunity for a long position, even in spot markets.
🔹On-Chain Analysis of LINK
▪️ In the $18.48 to $19 price range, a significant number of LINK tokens are in loss, which could act as a resistance level. However, there is currently no substantial volume of coins in profit to establish strong on-chain support.
▪️ On a positive note, network activity is showing signs of recovery, with a rise in active and new addresses, reflecting increased user engagement. Additionally, 48% of LINK tokens are held by whales, a considerably higher percentage compared to other cryptocurrencies. This distribution makes price manipulation by whales more difficult, contributing to market stability.
▪️ From a supply and demand perspective, the recent price drop has led to increased demand from whales (addresses holding 10M–100M LINK), while retail investors have been selling. This redistribution of tokens from smaller holders to large investors could be interpreted as a bullish signal for the medium term.
✅ Now that we have reviewed the project, let's move on to the technical analysis of this coin
📅 Weekly Timeframe
As observed, after the conclusion of the 2021 bull run, LINK entered a correction phase and dropped to a low of $5.85. Upon reaching this level, it formed a very clean Accumulation Zone with a floor at $5.85 and a ceiling at $9.77.
🔍 After oscillating within this zone for about a year, LINK finally broke out towards the end of 2023, coinciding with Bitcoin’s new all-time high near $70,000. This upward move was robust, but following Bitcoin’s correction to a low of $54,000, LINK also pulled back deeply to $9.77, where it stabilized.
📊 The volume has been in favor of the buyers, and as the upward trend concluded and a corrective leg began, the volume decreased significantly. Once the volume reached its lowest, a large bullish candle entered the market, pushing the price up to a high of $30.16.
⚡️ Currently, as Bitcoin ranges and corrects, LINK is also undergoing a correction. The RSI oscillator shows that LINK has dipped below the 50 area, but as long as it remains above 42.88, I still view LINK’s momentum as bullish.
🛒 For buying opportunities, risky purchases could be considered upon confirming a break of $30.16 or a more substantial breakout at the ATH of $51.30. However, if the price heads back towards $9.77 and breaks this support, it could indicate that the bullish momentum and trend have fully concluded, potentially leading to new lows.
🔹What is Chainlink?!
🔹Chainlink is a decentralized oracle network that enables smart contracts to securely interact with real-world data, external APIs, and off-chain computations. Founded in 2017, Chainlink solves the "oracle problem" by providing tamper-proof, trust-minimized data for blockchain applications.
🔹Chainlink has become a critical infrastructure in the DeFi (Decentralized Finance) ecosystem, enabling hybrid smart contracts that leverage off-chain data. With partnerships in traditional finance, gaming, insurance, and enterprise solutions, Chainlink is positioning itself as the primary gateway between blockchains and real-world data.
🔹Chainlink’s Core Technology & Products
▪️ A. Decentralized Oracle Networks (DONs):
Chainlink’s oracle networks retrieve, verify, and deliver off-chain data to on-chain smart contracts in a secure and decentralized manner. These oracles solve blockchain’s lack of external connectivity, making real-world data accessible in DeFi, insurance, gaming, and enterprise applications.
B. Cross-Chain Communication (CCIP):
Chainlink enables cross-chain data sharing between public and private blockchains, allowing seamless communication and transfer of value across multiple networks.
▪️ C. Data Feeds & Market Insights:
Price Oracles: Secure on-chain price feeds for assets like BTC, ETH, stablecoins, and commodities.
Proof of Reserve: Verifies asset collateralization in real-time, crucial for stablecoins and wrapped assets.
Data Streams: Provides high-frequency market data for next-gen DeFi protocols.
▪️ D. Compute Services:
- Functions: Connects smart contracts to any API, enabling custom Web3 applications.
- Automation: Automates smart contracts with event-based triggers.
- Verifiable Random Function (VRF): Ensures secure randomness in gaming, NFTs, and lotteries.
🔹Chainlink’s Economic Model & Tokenomics
A. LINK Token Utility
The LINK token is the native cryptocurrency of the Chainlink ecosystem, used for:
🔹Paying node operators for retrieving, verifying, and delivering data.
🔹Staking to provide economic security and ensure data integrity.
🔹Governance and ecosystem incentives.
B. Staking & Security Mechanism:
Chainlink introduced staking as part of its Chainlink Economics 2.0 model to enhance security:
🔹Node operators must stake LINK to provide data services.
🔹Validators get slashed for incorrect or malicious data submissions.
🔹Delegated staking allows non-technical users to stake LINK via trusted operators.
C. Token Distribution
🔹ICO Price (2017): $0.11
🔹Total Supply: 1 billion LINK
🔹Circulating Supply: ~450M LINK (45% of total)
🔹Token Allocation:
-35% for ecosystem development and node incentives.
-35% sold in ICO/public sales.
-30% retained by Chainlink Labs for network growth.
D. Market Performance & ROI
🔹All-Time High (ATH) Price: $52.88 (May 2021)
🔹ICO ROI: 484.11x (+48,311%)
🔹Private Sale ROI: 587.5x (+58,650%)
🔹Total Funds Raised: 32M (ICO: 3M, Private Sale:
29M
)
🔹Some of Investors: Hashed Fund, Framework Ventures and Fundamental Labs
——
🔹Chainlink’s Adoption & Use Cases
A. Financial Services & DeFi
Chainlink secures billions of dollars in DeFi protocols, including:
🔹Aave (lending and borrowing)
🔹Compound (decentralized finance)
🔹Synthetix (synthetic assets)
🔹Uniswap (decentralized exchanges)
B. Asset Tokenization & Enterprise Adoption
Chainlink enables tokenization of real-world assets (RWA), integrating blockchain technology into:
🔹Traditional banking and payments
🔹Supply chain transparency
🔹Enterprise solutions (e.g., SWIFT, Google Cloud, FedEx, AccuWeather)
C. Gaming & NFTs
🔹VRF ensures fairness in blockchain gaming and NFTs.
🔹Major NFT & metaverse projects rely on Chainlink for secure randomness.
D. Insurance & Climate Markets
🔹Weather-based smart contract automation for crop insurance.
🔹Secure insurance claim processing using verified external data.
🗺Chainlink (LINK) Roadmap
Chainlink is evolving rapidly to enhance scalability, decentralization, and utility across blockchain ecosystems. The Chainlink 2.0 upgrade and Economic Model 2.0 are set to play crucial roles in the network’s future. Here’s a breakdown of Chainlink’s roadmap and upcoming developments.
A. Next-Gen Oracle Solutions
Chainlink 2.0 expands Decentralized Oracle Networks (DONs), introducing:
🔹Off-Chain Reporting (OCR) for better efficiency.
🔹Hybrid computation models for privacy and scalability.
🔹Fair Sequencing Services (FSS) to prevent front-running in DeFi.
B. Staking Expansion
🔹Staking rewards expected to start at 5% APY, paid via fees + emissions from the Chainlink treasury.
🔹Full staking implementation in Chainlink Economics 2.0 to ensure sustainable network growth.
C. Cross-Chain Integration & Layer 2 Adoption
🔹Chainlink plans deeper integration with Layer 2 solutions like Arbitrum & Optimism.
🔹Further adoption into non-EVM blockchains like Solana, Polkadot, and Cosmos.
🏦 Strategic Partnerships & Institutional Adoption
Corporate & Enterprise Partnerships: Chainlink has secured high-profile collaborations with:
-Google Cloud: Integrated Chainlink oracles for Web3 data verification.
-SWIFT: Exploring cross-border transactions using Chainlink.
-AccuWeather & FedEx: Providing real-world data for blockchain use cases.
-Associated Press: Integrating trusted news data into smart contracts.
🔹Advisory Team & Leadership
-Sergey Nazarov (CEO): Blockchain visionary, co-founder of SmartContract.com.
-Steve Ellis (CTO): Co-founder & lead engineer behind Chainlink.
-Eric Schmidt (Ex-Google CEO): Joined as technical advisor.
🔧Security & Consensus Mechanism
-Ethereum-based ERC-20 token with Proof-of-Stake (PoS) consensus.
-Delegated Proof-of-Stake (DPoS) & Proof-of-Authority (PoA) used for oracle security.
-Multi-layered decentralization ensures resilience against data manipulation.
🔹Market Outlook & Future Predictions
Competitive Edge:
-Most adopted decentralized oracle network.
-75B+ secured across 1,000+ projects.
-Expanding beyond crypto into traditional finance & enterprise applications.
Challenges & Risks
-Reliance on Ethereum scalability.
-High competition from newer oracle solutions (e.g., --Band Protocol, API3).
-Adoption rate depends on broader DeFi growth.
👛Some of the wallets that support Chainlink
MetaMask
Ledger Wallets (Nano S & Nano X)
Exodus Wallet
WalletConnect
Rabby Wallet
Trust Wallet
Atomic Wallet
Coin98 Wallet
Trezor Wallet
Argent Wallet
—
🔹Platform for staking LINK
Stake.link
Chainlink
Stake.com
—-
Platform for providing LINK
🔹Retro
🔹Biswap
🔹Kujiro
🔹Mdex
🔹Tomb
🔹Ramses
🔹Honeyswap
🔹Uniswap
🔹Pancakeswap
🔹LFJ
🔹Pangolin
🔹Balancer
🔹Revenue and Staking
▪️ Since the beginning of February, Chainlink's revenue experienced a sharp decline followed by a notable recovery, rising from -0.015 to 0.06 Ethereum. Meanwhile, staking activity in 2025 has remained relatively stable at approximately 279,000 Ethereum, showing no significant fluctuations. Additionally, the increase in network fees highlights growing user engagement and heightened activity within the ecosystem.
📝 Final Thoughts
This analysis reflects our opinions and is not financial advice.
Share your thoughts in the comments, and don’t forget to share this analysis with your friends! ❤️
