LINK/USDT 1W chart ReviewHello everyone, let's look at the 1W link to USDT, in this situation we can see how the price moves under the downward trend line, but we can see some price stabilization, which can affect the potential change of trend. However, let's start by defining goals for the near future the price must face:
T1 = 19.20 $
T2 = = $ 21.67
Т3 = $ 25
T4 = $ 27.65
Let's go to Stop-Loss now in case of further declines on the market:
SL1 = $ 16.82
SL2 = $ 14.90
SL3 = 12.73 $
Looking at the RSI indicator, we see the descent below the lower limit of the range, which may also indicate
LINKUST trade ideas

Chainlink: Strong Long Opportunity with $22 Target Ahead
A long position looks promising with $22 as the first target and potential for further upside. The VAL zone serves as a solid entry area. The nearest imbalance zone could act as resistance, making it a key level to watch.
COINBASE:LINKUSD BINANCE:LINKUSDT

LINK STARTEDhello friends
This potential coin finally started its trend.
Considering the sharp movement he has made, we expect that the specified targets will move.
The loss limit of this currency is the red line, if it falls below it, we will exit with a small loss.
Note that this coin has a lot of potential.
Don't forget capital management.
Be successful and profitable.

Link LINK is positioned on a crucial support level and can move up to higher levels from here. However, its movement is highly dependent on Bitcoin; if Bitcoin declines, LINK's support will also break.

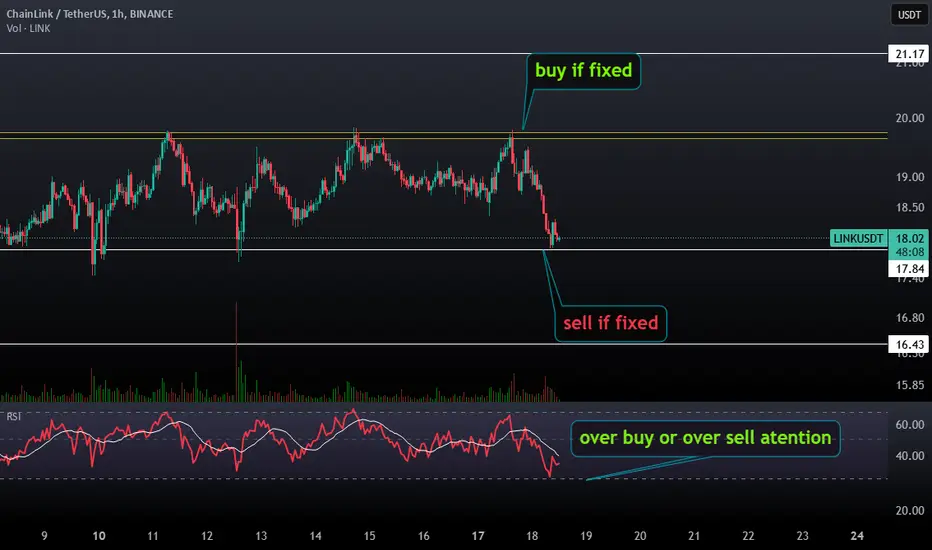
LINK/USDT 1H: Bearish Breakdown – Targeting $17.20 Support?"LINK/USDT 1H: Bearish Breakdown – Targeting $17.20 Support?
🚀 Follow me on TradingView if you respect our charts! 📈 Daily updates!
Current Market Structure:
Price is exhibiting a bearish trend after breaking key support at $18.40.
Current trading around $17.83 indicates further downside potential.
Market Maker Activity:
Distribution pattern is visible with lower highs and lower lows.
Market makers are likely targeting liquidity around $17.20.
Technical Indicators:
Hidden bearish divergence on RSI reinforces the downtrend.
Volume profile confirms ongoing distribution.
Trade Setup (Confidence 7.5/10):
Entry: Short entry on a retest in the $17.90-$18.00 zone.
Targets:
T1: $17.40
T2: $17.20
Stop Loss: Place above recent highs at $18.45.
Risk Score:
8/10 – High-risk environment with a favorable risk-to-reward, provided key levels hold.
Recommendation:
Short positions are recommended once a retest of the $18.00 resistance is confirmed.
Monitor volume closely and wait for confirmation before entering.
🚀 Follow me on TradingView if you respect our charts! 📈 Daily updates!


LINK
"Friends, please wait for the proof, and make sure to manage your capital. And when taking a selling position, be sure to respect early risk-to-reward ratios or risk-free setups."
LINK USDT➡️ CRYPTOCAP:LINK showing strong bullish momentum 🚀
✅ Higher lows are forming
✅ Accumulation phase looks complete
#LINK A breakout above the key zone could send CRYPTOCAP:LINK
towards:
🎯 Target 1 - $32.70
🎯 Target 2 - $45.41
This structure suggests a long-term uptrend 📈🔥

LINK Accumulation zoneHello Traders 🐺,
This idea is just a quick update on my previous analysis of LINK . We will be discussing the immediate short-term movements, but for a better perspective, you can check out my previous idea about LINK, which you can find in the related link next to this one! 👇🔥
Before we dive in, make sure to follow me so you can stay updated on the market situation.
As you can see in the chart above, LINK is currently in the Accumulation Zone . In my opinion, this is a great opportunity to buy altcoins, especially those with higher liquidity and reputation . These prices present a nice discount , making it a good time to buy and hold for the next 2 or 3 months!
🐺 Stay sharp, trade smart! – KIU_COIN 🐺

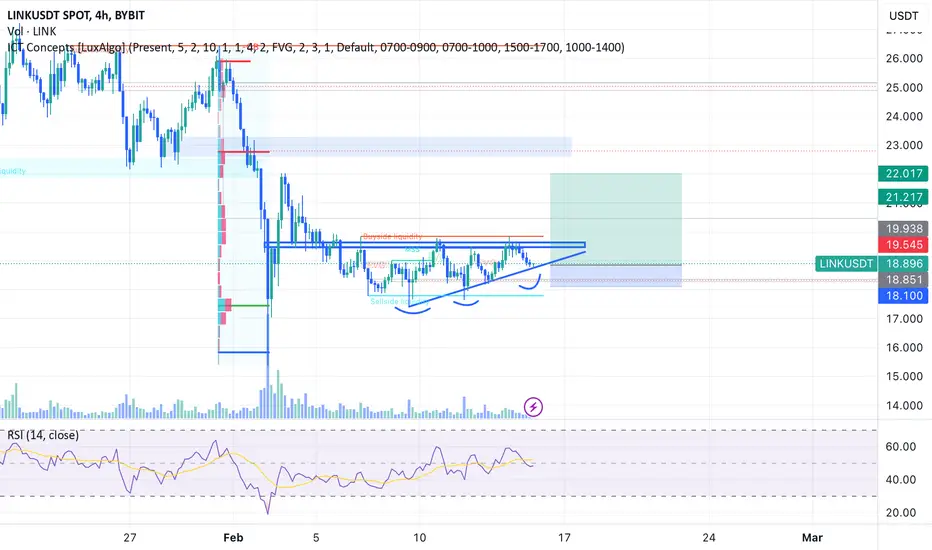
LINK/USDT Long Setup
🔹 Entry: CMP (18.876)
🔹 Stop-Loss: 18.459 (RR 8) or 18.1 (RR 4) – Adjust as per risk tolerance
🔹 Take-Profit Targets:
* TP1: 19.54 ✅
* TP2: 21.00 🚀
* TP3: 22.00 🎯
Technical Analysis 🧐
* Ascending Triangle Pattern: LINK/USDT is forming a bullish ascending triangle, indicating a potential breakout.
* Order Block & Support: Strong demand zone near the entry level, providing a solid base for an upward move.
* Resistance Levels: TP levels align with key resistance areas, making them ideal targets.
📉 Risk-Reward Ratio:
* SL at 18.459 → RR 8
* SL at 18.1 → RR 4
🛑 Disclaimer: This is NOT financial advice. Always DYOR (Do Your Own Research) before trading.
🚀 Let me know your thoughts in the comments!
Be careful with LINK !!!The price has formed a Triangle on the 4h time frame, and if it breaks out, it can drive the price up to around $21.70 .
Give me some energy !!
✨We spend hours finding potential opportunities and writing useful ideas, we would be happy if you support us.
Best regards CobraVanguard.💚
_ _ _ _ __ _ _ _ _ _ _ _ _ _ _ _ _ _ _ _ _ _ _ _ _ _ _ _ _ _ _ _
✅Thank you, and for more ideas, hit ❤️Like❤️ and 🌟Follow🌟!
⚠️Things can change...
The markets are always changing and even with all these signals, the market changes tend to be strong and fast!!

LINKUSDT Ready to Explode or Fakeout Incoming? Don’t Get TrappedYello, Paradisers! Is LINKUSDT finally gearing up for a strong breakout, or is another shakeout coming? Let’s break it down.
💎LINKUSDT has been looking good after completing a double zigzag corrective pattern. The price has also formed a descending channel with a bullish divergence, signaling potential upward momentum. On the lower timeframes, we can spot a developing W pattern, but for a confirmed breakout, we need to see: A clean breakout above resistance & A candle closing above resistance with strong volume.
💎If the market sees further retracement or panic selling, a bounce from the key support zone is likely. However, to increase our probability of success, we’ll be watching for bullish I-CHoCH, a confirmed W pattern, or an inverse head and shoulders on lower timeframes.
💎If LINKUSDT breaks down and closes candle below support, the bullish setup will be invalidated. In that case, waiting for a better price action setup will be the smart move.
🎖 Patience and discipline are what separate pros from amateurs. Stick to high-probability setups and wait for confirmation. That’s how we win long-term!
MyCryptoParadise
iFeel the success🌴

LINK buy/long setup (4H TF)After forming a low, the price is ranging and creating higher Ls. A trigger line has formed, and it is expected to be broken soon.
Targets are marked on the image.
A daily candle closing below the invalidation level will invalidate this analysis.
Do not enter the position without capital management and stop setting
Comment if you have any questions
thank you


LINKUSD BUY ANALYSIS SMART MONEY CONCEPT Here on Linkusdt price has form a demand around area of 17.96 which is likely to continue moving up so trader should go for long with expect profit target of 18.95 and 19.82 . Use money management

LINK PREVIOUS CHART UPDATE AND NEXT MOVE.CRYPTOCAP:LINK previous trade idea update.
Here took FVG then went up to 3-4% profit then again went down during CPI news, took the previous day liquidity and went up to almost 8% profit.
In this trade we made some profit on the first 3-4% move.
👉 What’s next:- after taking the previous day's liquidity it did MSS with repainting bullish FVG. Where we can long for other long opportunities.

LINKUSDT BULISHo start, I want to mention that if the targets in this analysis are achieved in a short time, it could indicate that the entire altcoin market will turn bullish very soon.
Please pay close attention to the danger zone and stop loss levels. If the closing candle breaks below the stop loss, this analysis will be invalidated.
Note: My ideas are not intended for any type of scalping or scalpers!
You can find the full list of my ideas here: www.tradingview.com
Here are some of my ideas:

LINK/USDT 1W 🩸 CRYPTOCAP:LINK ⁀➷
#Chainlink. Macro chart Another
💯 Intermediate Target - $35
🚩 Macro Target 1 - $48
🚩 Macro Target 2 - $72
🚩 Macro Target 3 - $104
- Not financial advice, trade with caution.
#Crypto #Chainlink #LINK #Investment
✅ Stay updated on market news and developments that may influence the price of Chainlink. Positive or negative news can significantly impact the cryptocurrency's value.
✅ Exercise patience and discipline when executing your trading plan. Avoid making impulsive decisions driven by emotions, and adhere to your strategy even during periods of market volatility.
✅ Remember that trading always involves risk, and there are no guarantees of profit. Conduct thorough research, analyze market conditions, and be prepared for various scenarios. Trade only with funds you can afford to lose and avoid excessive risk-taking.

LINK: Potential 10x Play?LINK has spent years forming a massive symmetrical triangle.
It has already broken out and is currently in its second retest of the upper boundary.
Using a conservative measurement from the triangle pattern, the maximum estimated upside is around $190-$200—a potential 10x move from here.
📌 Entry & Stop-Loss Strategy
If entering now, a reasonable stop-loss could be set at the Feb 3rd wick low, which also aligns with a key support/resistance flip (light blue line).
If the light blue line fails, there’s a high chance of breaking back into the triangle.
But even if that happens, LINK could still see a strong recovery after some consolidation.
🔥 Why is BINANCE:LINKUSDT worth watching?
It’s included in Coinbase 50 Index, Grayscale Trust, and World Liberty Financial (a decentralized project supported by Trump & his family).
It’s also a “Made in USA” project—an attractive narrative for traders.
With so many hype factors, once the bull market kicks in, CRYPTOCAP:LINK could get heavily pumped by news catalysts.
At that point, who knows—10x might be just the beginning. 🚀
🔴 for more future script “guesses” like this! 😃
🔥 I've dropped another 2 analyses for the 2025 altseason on the right hand side if you're using computer, and scroll down a bit to see the link if you're using mobile.

LINK-4HLet's take a quick look at LINK. This project is part of the DeFi and Crosschain sectors and is currently ranked 11th on CoinMarketCap with a market cap of $11.9 billion. The analysis is conducted on the 4-hour timeframe.
🔍 As you can see, the price is moving within a descending channel, which is for the daily timeframe. However, in this timeframe as well, the price is reacting well to the key areas of the channel.
✨ Currently, the price is at the bottom of the channel, and price action in this area is very important because it can determine the price movement for the next few days or even weeks.
📉 For a short position, if the channel breaks downward and the $18.10 support level, which is a very important support, is broken, you can enter a position and follow the next bearish leg. Set a wide stop-loss because we are capturing the Medium Wave Cycle (MWC), and if the stop-loss is too tight, you might get stopped out before the price moves.
💫 If the RSI breaks the 33.86 support, we can confirm the entry of bearish momentum. In this case, the $16.28 target could be reachable.
📈 For a long position, the first trigger is breaking the $18.92 area. This position is very risky, so enter with the lowest risk your strategy allows. A break above 50 on the RSI would be a strong confirmation for this position, and its target could be the midline of the channel.
🚀 Overall, for a trend reversal and the start of a bullish trend, in my opinion, the price needs to either stabilize above $22.49 or form a higher high and higher low above the midline of the channel. The main trend reversal will occur after breaking the channel and the $26.67 resistance.
📊 Market volume is decreasing day by day, which brings the move closer. So I recommend keeping an eye on the market in the coming days.

A U.S. backed crypto that has fallen behind the marketHello, traders! 🐺
First of all, I want to thank you for your incredible support ! My last idea about ETH went absolutely viral on TradingView , and as of now, it’s among the most popular ideas about ETH !
So, thanks a lot! 🙌 Now, let's dive into a hidden gem that could potentially perform like Solana and XRP , both of which have done exceptionally well in the past few months! 🚀
As you can see in the chart above, LINK is currently above the symmetrical triangle and just below a key resistance level around its ATH price at the $36 area .
In my humble opinion, this is a great buying opportunity for LINK because:
1️⃣ The chart structure is a mix of what we've already seen in ETH and what previously formed in XRP. I’ll discuss this in detail in my next idea about XRP, so make sure to follow me to stay updated !
2️⃣ BTC.D is at its peak , so if you ask me— what could be better than buying at a discount ? Especially when it’s a solid and fundamentally strong project like LINK !
Just imagine—if ETH breaks to its ATH and follows my idea all the way to $17K, what could the price of LINK be? 🚀
In the smaller time frame :
you can go into the long position when price break above the wedge resistance line and put your stop loss below the previous low
( this is not a financial advice )

Trading opportunity for LINKUSDTBased on technical factors there is a Buy position in :
📊 LINKUSDT
🔵 Buy Now
🪫Stop loss 17.30
🔋Target 22.22
📏 R/R 2
💸RISK : 1%
We hope it is profitable for you ❤️
Please support our activity with your likes👍 and comments📝

Can LINK Reclaim $20?The expected bearish correction has played out, with LINK forming a potential bottom in the highlighted support zone ($17.20 - $17.80). Bulls are expected to step in within this range to defend support and attempt a recovery.
A breakout above the $20 resistance level would be an early sign of bullish momentum and potential bottom formation.
