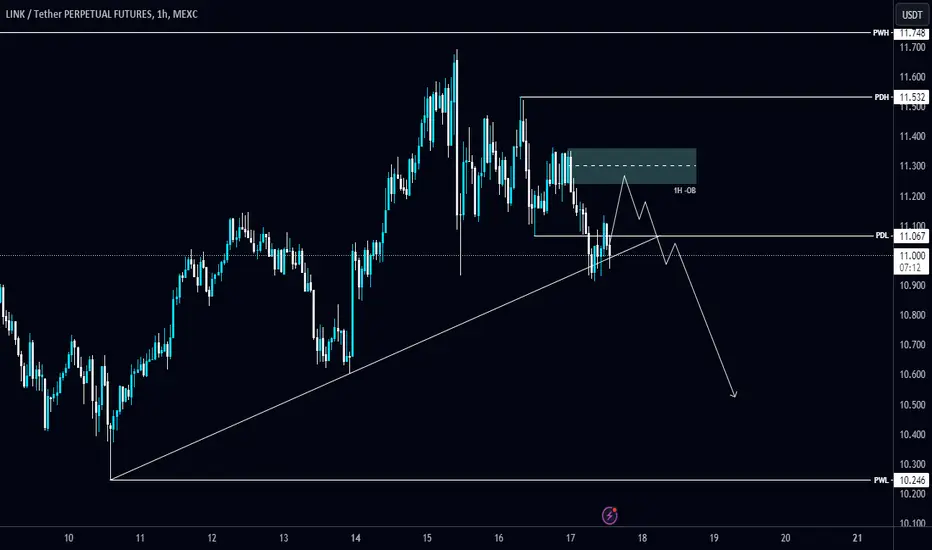
#LINK/USDT is holding the Diagonal Trendline in 1-Hour TF!#LINK/USDT is holding the Diagonal Trendline in 1-Hour TF!
Wait for 1H bearish Order Block to short $LINK. The local resistance level is PDH's $11.53, and the support level is PWL's $10.245.
LINKUST trade ideas
Chainlink Price Poised for a Breakout: Can $LINK Reach $13?Chainlink ( BIST:LINK ), one of the most talked-about cryptocurrencies in the blockchain space, is showing signs of a potential breakout this October. After a volatile few months, the token has seen steady gains, rising from $10.60 to $11.13—a nearly 4% increase within the last week. This upward movement, alongside promising network developments and technical indicators, has investors speculating on whether the token can surpass the $13 mark in the near term.
Technical Outlook: Chainlink’s Path to $13
Technically, Chainlink’s price action presents both challenges and opportunities. The token is currently trading below its 200- and 100-day moving averages (MAs), reflecting a cautious market sentiment. However, the narrowing of the Bollinger Bands suggests a breakout could be on the horizon, with $13 as a potential upside target. Additionally, the MACD indicator is converging into a positive territory, hinting at a bullish momentum that may push the price higher in the coming days.
Despite some recent bearish signals, including a 2.53% decline as of this writing and a moderate RSI of 50.03, the token has held strong above key support levels. The next major test for Chainlink ( BIST:LINK ) will be overcoming the $12 pivot, a point seen by analysts as a significant resistance. If BIST:LINK breaks through, it could solidify the move to $13, especially given the bullish environment often associated with "Uptober"—a historically favorable month for cryptocurrencies.
Drivers of Chainlink’s Growth
Chainlink’s recent network upgrades and strategic partnerships are driving its price momentum. The introduction of staking has boosted investor confidence, offering them an opportunity to lock up tokens and earn rewards, reducing the circulating supply and increasing scarcity. Moreover, Chainlink’s Oracle services, which provide secure and reliable off-chain data to smart contracts, have expanded with the integration of Secure Mint.
The adoption of Chainlink’s Cross-Chain Interoperability Protocol (CCIP) by major players like Ronin, the gaming-focused EVM blockchain, is further strengthening the network’s ecosystem. As more platforms adopt Chainlink’s technology, the demand for LINK tokens continues to rise.
Whale Accumulation and Market Sentiment
Chainlink’s whale activity has surged, which is often a bullish signal. According to data from Santiment, the number of large BIST:LINK holders has increased from 489 to 502 in early October. Whale accumulation typically indicates that major investors expect the price to rise in the future, reinforcing the narrative of a potential breakout. Additionally, increased active addresses and transaction volumes reflect growing interest and usage of the Chainlink network.
Increased whale activity also raises the possibility of a short squeeze. Many traders currently hold short positions, and if Chainlink ( BIST:LINK ) can break through the $12 resistance, it could force short sellers to cover their positions, leading to a rapid price increase.
Potential Risks and Support Levels
While Chainlink’s future looks bright, there are risks to consider. The token remains vulnerable to broader market corrections, and a failure to hold above the $10.27 support level could see it retrace further, potentially to the $9.50 mark. Additionally, its underperformance compared to Bitcoin ( CRYPTOCAP:BTC ), which has seen stronger gains in recent days, highlights the possibility of more bearish moves if the overall market sentiment shifts.
However, if Chainlink ( BIST:LINK ) can continue building on its network upgrades and overcome key technical hurdles, the stage is set for a strong October performance, with $13 well within reach.
Conclusion: Is Chainlink Set for a Rally?
As of now, Chainlink is positioning itself for a potential breakout above $13, with the technical indicators and fundamental drivers both supporting an optimistic outlook. Increased whale activity, low exchange reserves, and major network developments all contribute to the bullish sentiment around the token. While the token faces immediate resistance at the $12 pivot, a successful breakout could set Chainlink on a bullish trajectory for the rest of October and beyond.

$LINK is going to break the line soon#link is going to break the line soon, I'm opening a long position x15 with the first TP at 15.5.

LINK/USDT 1W chart reviewHello everyone, let's look at the current situation of LINK 1W interval. In this situation, we can see the price rebounding from the downtrend line.
Let's start by setting goals for the near future, which include:
T1 = $11.49
T2 = $13.66
T3 = $15.54
T4 = $17.27
Now let's move on to the stop-loss in case the market continues to decline:
SL1 = $9.27. SL2 = $7.35. SL3 = $5.53
Looking at the RSI indicator, we see
as the movement took place in the upper range, which could have influenced the change in the direction of movement, giving a price recovery.

LINK USDT- CLICK HERE TO CHECK NEW ANALYSISThe breakout will decide the direction. We can go bullish or bearish, depends on bitcoin! Waiting for key zone

#LINK/USDT#LINK
The price is moving within a descending channel pattern on the 4-hour frame and is expected to break upwards after it has adhered to it to a large extent
We have a downtrend on the RSI indicator that is expected to break upwards and we have a trend to stabilize above it
We have a major support level in green at a price of 8
We have a trend to stabilize above the moving average 100, which supports the rise
Entry price 9.40
First target 11.32
Second target 12.63
Third target 13.86


LINK Analysis: Key Levels Triggers in Consolidation Phase✨ Welcome to Today's LINK Analysis
In today's analysis, I will examine the LINK token and identify key triggers for both futures and spot trading. I hope this analysis will be useful to you.
🔍 About Chainlink (LINK)
This project offers a highly intriguing concept. Its primary goal is to bridge off-chain data with on-chain environments. This means that off-chain data can be transferred to the blockchain without any alteration. LINK tokens can be used as a payment token within the platform and also for staking.
⏳ Daily Timeframe Analysis
Starting with the daily timeframe, after reaching the resistance level of $21.71, the price entered a consolidation phase, ranging between $21.71 and $12.95 for a while. During this period, the candle volumes gradually decreased until the $12.95 support was broken, causing the price to drop to the $9.51 support.
🔽After hitting this support, the price again entered a consolidation phase, even reaching the $12.95 level. Now, a range has formed between $9.51 and $12.95. A suitable buy trigger in the spot market would be the breakout of $12.95, with a stop-loss set around the $9.51 or, more riskily, $10.5 levels. A break above the 50 and 41.48 levels on the RSI could confirm the entry of momentum. Always make sure to set a stop-loss and manage your capital to avoid significant losses.
🛑 If you've already purchased LINK and are looking for a stop-loss point, the $9.51 zone could serve as a good stop-loss. For targets, the short-term target is $15.06, and for long-term holders, it's $21.71.
📈Futures Trading Triggers
For futures trading, $11.47 is a good long trigger, and $10.50 is suitable for shorts. To further assess the situation, let's move to the 4-hour timeframe.
⏳4-Hour Timeframe Analysis
In the 4-hour timeframe, more details are visible, and some solid futures triggers can be identified. Currently, the selling volume exceeds the buying volume, as the bearish waves have higher volumes compared to the bullish ones.
📈For a long position, the $11.69 trigger could target the top of the box, while breaking $12.95 would signal the main long position. A break above 62.42 on the RSI would be important and could indicate a bullish momentum shift, but it’s also crucial for buying volume to increase.
📉For a short position, the $10.43 break is suitable and could lead the price to the $9.51 floor. The volume and momentum are aligned with the market's downtrend. The main short position would be triggered by breaking the $9.51 level, which is LINK's most critical support. If this zone is broken, we could see a sharp decline in price.
❌Disclaimer
This is not financial advice; it is merely my personal opinion on how the coin might move. Always conduct your own research before making any decisions.

LINKUSDTThe current price is trading below the baseline and key technical indicators such as RSI and Williams %R, signaling a potential shift towards bearish control over the price movement.

LINK Long Position (Major Support Level)Market Context: Many altcoins, including LINK, have retraced to critical levels of support, presenting an opportunity for a long trade. LINK is positioned well for a potential bounce, providing a favorable risk-to-reward ratio.
Trade Setup:
Entry: Between $10.00 - $10.90.
Take Profit:
First target: $12.50 - $13.30
Second target: $14.50 - $15.50
Stop Loss: Just below $9.40.
This setup leverages the strong support zone and potential for a bullish recovery. #LINK #Altcoins #Crypto

LINK ANALYSIS (12H)From where we put the red arrow on the chart, it looks like LINK has entered an ABC.
Wave B is a diametric, we are now in wave g of this diametric.
The best range for the g-wave to end is the red range.
Closing a daily candle above the invalidation level will violate this analysis
For risk management, please don't forget stop loss and capital management
Comment if you have any questions
Thank You

Chain linklink technical analysis basically on elliott waves Principles and RTM price action strategy
link can be down to 8$ and then grow to 31$
wait and watch.


LINKUSDTLINK ~ 1W ✅
#LINK Make purchases gradually in this pattern. it is only a matter of time until this pattern is broken out and the bulls will return quickly.

#LINK/USDT needs to clear the Diagonal Trendline in 1-Hour TF!#LINK/USDT needs to clear the Diagonal Trendline in 1-Hour TF!
Wait for trendline breakout/retest to long $LINK. The local resistance level is PWH's $13, and the support level is PWL's $10.9.

LINK LONGBecause of the geopolitical situation LINK dropped 2$. I am still bullish on LINK that will go above 13$

80% correction for $2 Chainlink in play?On the above 12 day chart price action has rallied almost 300% since the lows of 2023. A number of reasons now exist for a bearish outlook. They include:
1) Broken RSI and price action support.
2) The RSI 50 level is an incredibly important level for chainlink overall. Look left. Red arrows. Rejection from 50 has never been a good thing for price action with the smallest correction at 30%.
3) The bear flags. They are exactly the same, width, angle. A new candle will print on Friday 16th of August. The candle body MUST print inside the flag to prevent confirmation.
4) Confirmation of no. 3 results in a forecast to the $2.50 area.
Is it possible price action stops current correction? Sure.
Is it probable? No
Ww

LINK ANALYSISWhat's coming soon? I don't know, but this analysis is just one possible guess and could be wrong.
Today the situation may be that people hope that it will rise back (denial).
MD

LINK/USDT 4h chart reviewHello everyone, let's look at the 4H LINK to USDT chart, in this situation we can see how the price has moved up from the downward trend line and, despite the current correction, it still remains above the trend line.
Let's start by setting goals for the near future, which include:
T1 = $12.78
T2 = $13.31
T3 = $14.21
T4 = $14.84
Now let's move on to the stop-loss in case the market continues to decline:
SL1 = $11.68
SL2 = $10.85
SL3 = $10.29
SL4 = $9.56

LINK - Three White Soldiers Candlestick PatternIn the weekly timeframe, a bullish candlestick pattern has formed on Chainlink.
The Three White Soldiers are characterized by three consecutive green candles. The higher the timeframe, the more powerful the pattern. We've recently observed an instance of the TWS pattern in the weekly, which was a precursor to a 136% increase:
However, the unfilled wick around $8 remains a concern - but also a potential for buying in / accumulating at a lower price.
_________________________
BINANCE:LINKUSDT

Chainlink Bearish Trend Confirmed (Fear vs Greed)We can see Chainlink (LINKUSDT) reversing before reaching its EMA233 resistance. A bearish signal.
We can see that this pair has been in a bearish trend since March 2024.
We can see lower highs and lower lows.
We can see the continuation of this trend.
We can see another drop coming next.
We tend to postpone taking action until the time is right and things only get worse every day.
With experience, we realize that the right time never comes.
After the event, we think... I could have done such and such, if only I had the courage to take action before it was too late.
The chart is bearish.
Chainlink moves together with Bitcoin, Ethereum, Binance Coin, Solana and the rest.
Chainlink being bearish confirms a bearish Bitcoin.
The reversal right below EMA233 is a strong bearish signal.
The potential is high for another drop.
Prepare for the crash.
The final one if 2024.
Thank you for reading.
Namaste.

LINK, slowly linking the UPSIDE...LINK is currently ranging at 7.0 levels -- a strong order block support which have been revisited many times but always bounces off it.
This time, the movement on this range is thinning out significantly -- a prospect we might see a squeeze to the upside anytime now and hit 9.0+
Spotted at 7.0
TAYOR,
safeguard capital always.

$link old but gold!Hi guys!
My two modes are now the same, though the red line is more likely to me, but it may go through the red line in a different shape.
But what is almost proven to me is that the BIST:LINK can be a little different than other altocins.
My previous analysis of the Altcoins was not right, but many of us thought there was a Bull Run for the altcoins, but now I have come to the conclusion that only a limited number of altcoins can experience Bull Run, one of which is $link.
thank you
