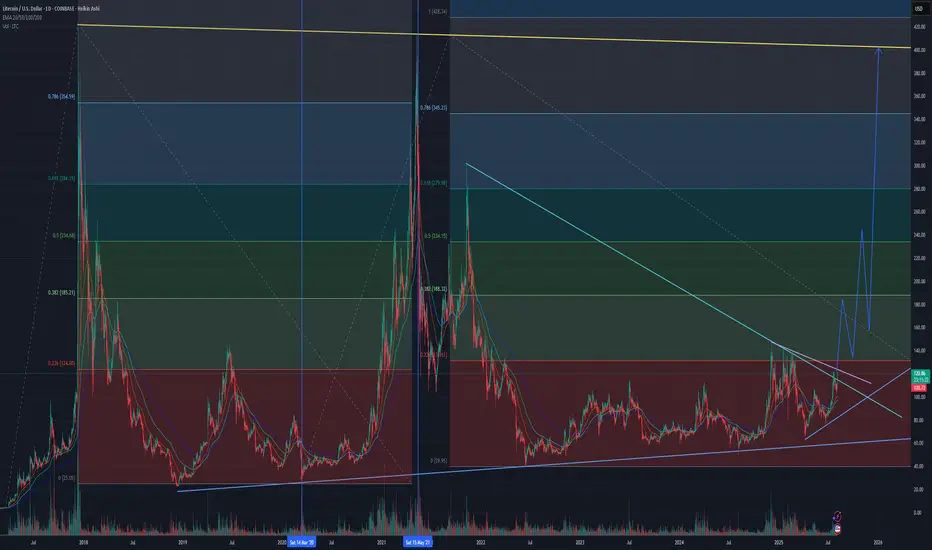
Why Litecoin is my #1 pick right nowObserving the price action between the two vertical blue lines (the '20 to '21 bull cycle), and comparing to the trend based fib extension levels on the left, we have a blueprint for the fib levels that LTCUSD responds to. At the .236 fib, a 24% pullback. At the .382 a 36% pullback. At the .5 a 38%
Key stats
Related pairs
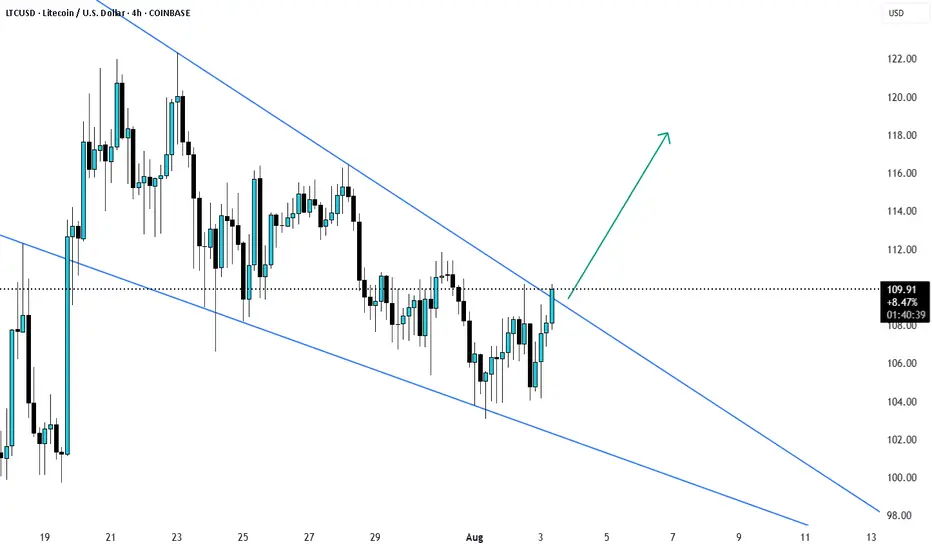
LTCUSD Breakout? wait for candle to closeLTCUSD trading in a down trend has now broken the resistance and wait till the candle is closed and possibly retest and then enter the trade. target can be 118-120

LTC/USD – Momentum Cooling at the Top🔴 SHORT if $121.00 gives way – retrace potential toward $119.50
Litecoin is stalling after rejection near $123.98, with RSI softening from overbought levels. Price remains above the 200 SMA, but failure to hold $121 could trigger a short-term correction before any renewed bullish attempt.
📊 Keywor

LTC Could Be Gearing Up for a Massive Wave 3 post 1-2, 1-2 Litecoin (LTC) appears to have completed a 1-2, 1-2 wave pattern, a classic bullish setup in Elliott Wave theory that often precedes an explosive move.
This nested formation signals strong internal momentum, where both the higher and lower degree structures are aligned for upside. If the count hold
Is Litecoin a free ride to $400?Taking a look at what I believe may be the most undervalued asset in the market as it has broken out of a trend line and is headed towards another test of a monthly level. This level has proven multiple times to be very rewarding. I think this may end up being one of the easiest trades in the market

LTC Adoption CurveThere was adoptions like this: TV, color TV, refrigerator, phone, mobile phone, pc. Now it's time for crypto. It's 7% today, summer 2025.

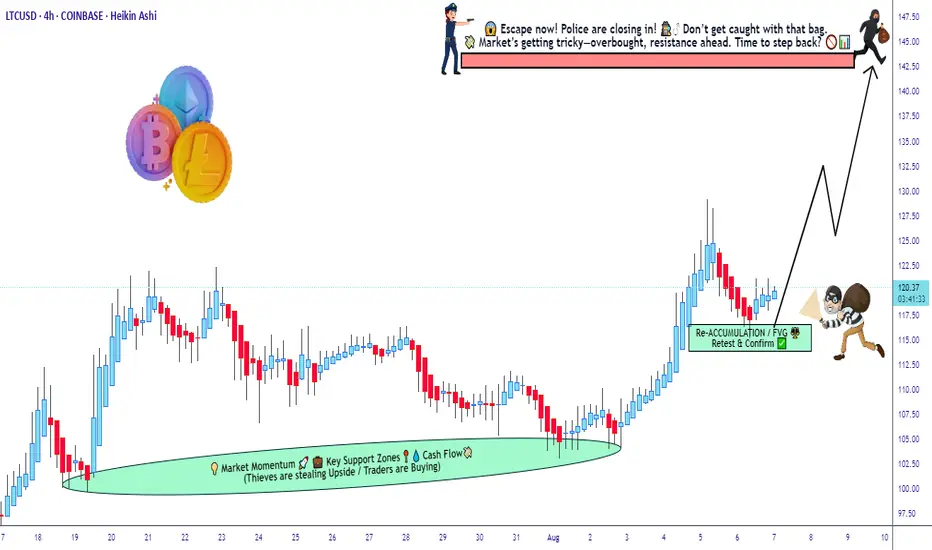
"Is LTC/USD the next target of a stealth bull raid?”🎯 LTC/USD HEIST ALERT: BULLISH LAYER HEIST PLAN! 💎🚁
PLUNDER PLAN: BULLISH
Thief entering the LTC/USD market with calculated stealth—multi-layered buy-limit entries, master-level layering strategy 🌪️💰
👾 ENTRY STRATEGY:
Stack multiple limit orders at staggered price levels (layering like a patient 🐍
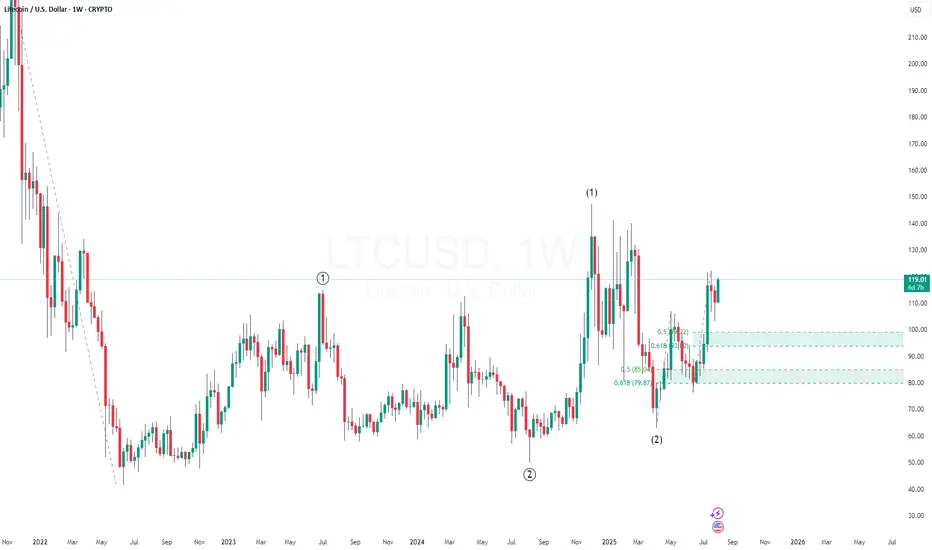
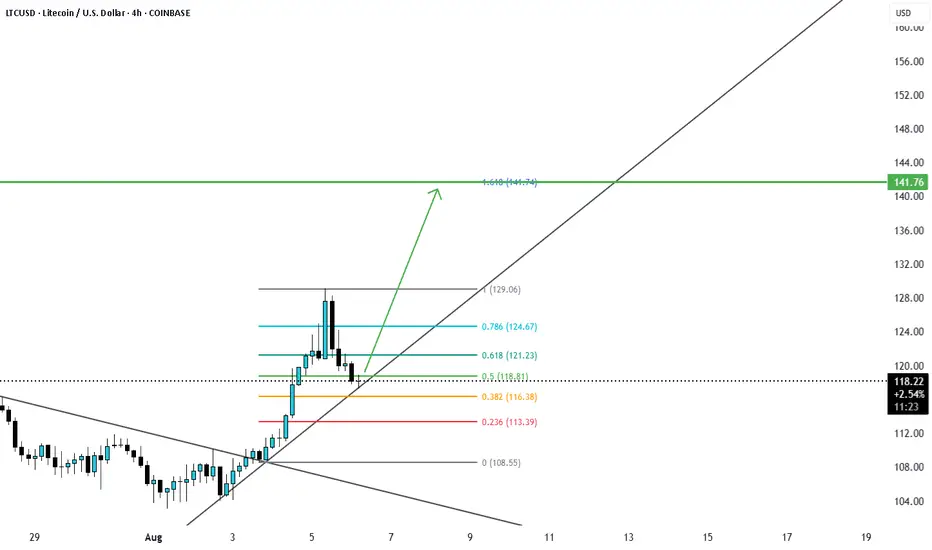
LTCUSD at Fib 0.5 and support price may resume up from hereLitecoin (LTC) recently broke out of a bullish wedge pattern, faced rejection around the $128–130 resistance zone, and has since retraced to the 0.5 Fibonacci level — presenting a potential entry point, with a stop-loss placed below the 0.382 Fib and a target around $140.
See all ideas
Displays a symbol's price movements over previous years to identify recurring trends.
Curated watchlists where LITECOIN is featured.

Gen 1 crypto: from little acorns grow
15 No. of Symbols

Proof of Work: Embracing the crunch
27 No. of Symbols

Top altcoins: Choose your alternatives carefully
28 No. of Symbols
See all sparks
Frequently Asked Questions
Litecoin (LTC) reached its highest price on May 10, 2021 — it amounted to 413.83 USD. Find more insights on the LTC price chart.
See the list of crypto gainers and choose what best fits your strategy.
See the list of crypto gainers and choose what best fits your strategy.
Litecoin (LTC) reached the lowest price of 21.06 USD on Mar 13, 2020. View more Litecoin dynamics on the price chart.
See the list of crypto losers to find unexpected opportunities.
See the list of crypto losers to find unexpected opportunities.
The safest choice when buying LTC is to go to a well-known crypto exchange. Some of the popular names are Binance, Coinbase, Kraken. But you'll have to find a reliable broker and create an account first. You can trade LTC right from TradingView charts — just choose a broker and connect to your account.
You can discuss Litecoin (LTC) with other users in our public chats, Minds or in the comments to Ideas.