LTCUSD H4 | Bearish reversal off pullback resistanceLitecoin (LTC/USD) is rising towards the sell entry that lines up with the 23.6% Fibonacci retracement and could drop lower.
Sell entry is at 110.45, which is a pullback resistance that aligns with the 23.6% Fibonacci retracement.
Stop loss is at 120.08, which is a swing high resistance.
Take profit is at 102.00, which is an overlap support that aligns with the 50% Fibonacci retracement.
High Risk Investment Warning
Trading Forex/CFDs on margin carries a high level of risk and may not be suitable for all investors. Leverage can work against you.
Stratos Markets Limited (tradu.com ):
CFDs are complex instruments and come with a high risk of losing money rapidly due to leverage. 65% of retail investor accounts lose money when trading CFDs with this provider. You should consider whether you understand how CFDs work and whether you can afford to take the high risk of losing your money.
Stratos Europe Ltd (tradu.com ):
CFDs are complex instruments and come with a high risk of losing money rapidly due to leverage. 66% of retail investor accounts lose money when trading CFDs with this provider. You should consider whether you understand how CFDs work and whether you can afford to take the high risk of losing your money.
Stratos Global LLC (tradu.com ):
Losses can exceed deposits.
Please be advised that the information presented on TradingView is provided to Tradu (‘Company’, ‘we’) by a third-party provider (‘TFA Global Pte Ltd’). Please be reminded that you are solely responsible for the trading decisions on your account. There is a very high degree of risk involved in trading. Any information and/or content is intended entirely for research, educational and informational purposes only and does not constitute investment or consultation advice or investment strategy. The information is not tailored to the investment needs of any specific person and therefore does not involve a consideration of any of the investment objectives, financial situation or needs of any viewer that may receive it. Kindly also note that past performance is not a reliable indicator of future results. Actual results may differ materially from those anticipated in forward-looking or past performance statements. We assume no liability as to the accuracy or completeness of any of the information and/or content provided herein and the Company cannot be held responsible for any omission, mistake nor for any loss or damage including without limitation to any loss of profit which may arise from reliance on any information supplied by TFA Global Pte Ltd.
The speaker(s) is neither an employee, agent nor representative of Tradu and is therefore acting independently. The opinions given are their own, constitute general market commentary, and do not constitute the opinion or advice of Tradu or any form of personal or investment advice. Tradu neither endorses nor guarantees offerings of third-party speakers, nor is Tradu responsible for the content, veracity or opinions of third-party speakers, presenters or participants.
LITECOIN trade ideas

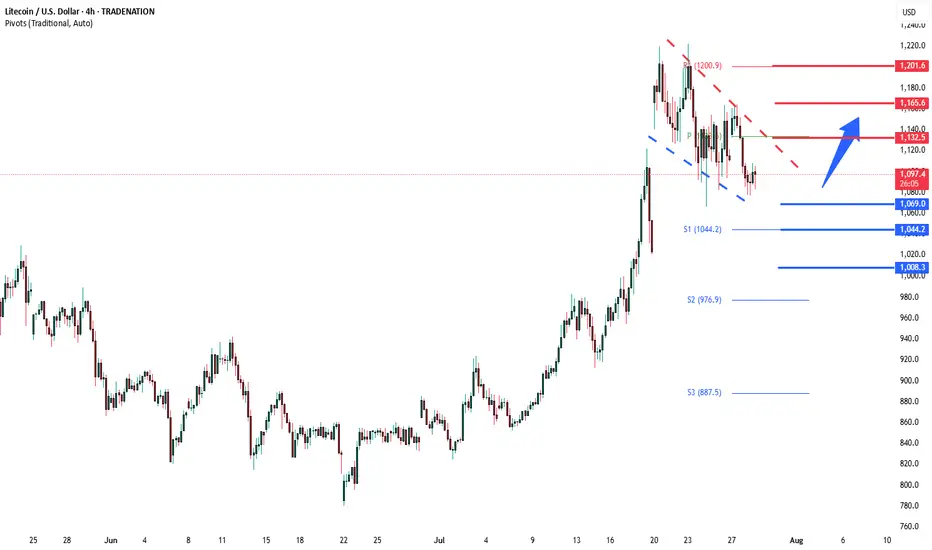
LTCUSD corrective pennant support at 1,070The LTCUSD remains in a bullish trend, with recent price action showing signs of a corrective pullback within the broader uptrend.
Support Zone: 1,070 – a key level from previous consolidation. Price is currently testing or approaching this level.
A bullish rebound from 1,070 would confirm ongoing upside momentum, with potential targets at:
1.132 – initial resistance
1,165 – psychological and structural level
1,200 – extended resistance on the longer-term chart
Bearish Scenario:
A confirmed break and daily close below 1,070 would weaken the bullish outlook and suggest deeper downside risk toward:
1,044 – minor support
1,008 – stronger support and potential demand zone
Outlook:
Bullish bias remains intact while the Gold holds above 1,070. A sustained break below this level could shift momentum to the downside in the short term.
This communication is for informational purposes only and should not be viewed as any form of recommendation as to a particular course of action or as investment advice. It is not intended as an offer or solicitation for the purchase or sale of any financial instrument or as an official confirmation of any transaction. Opinions, estimates and assumptions expressed herein are made as of the date of this communication and are subject to change without notice. This communication has been prepared based upon information, including market prices, data and other information, believed to be reliable; however, Trade Nation does not warrant its completeness or accuracy. All market prices and market data contained in or attached to this communication are indicative and subject to change without notice.
Litecoin: VWAP and Oversold Signal Potential BounceFenzoFx—Litecoin formed a double top at $116.4, causing a price dip. Currently, LTC trades near $110.1 after forming a double bottom. The Stochastic Oscillator is in oversold territory, suggesting a potential bounce, supported by VWAP from July 15.
Technically, if LTC holds above $110.1 and key support at $104.0, the uptrend could resume. In this scenario, the bullish targets would be $116.4 and $122.3.

Litecoin is Lagging.Company held Litecoin is emerging, we're only getting started. Arriba.
P.S. ETF deadline on August 4th, 2025.
CRYPTOCAP:LTC $113.80

LTC Litecoin USD Textbook Cup & HandleLitecoin should finish its correction over the weekend and as we get into August the momentum will shift back to the upside. This is a washout of over-leveraged positionsbefore the next massive leg up. I still see a correction down to about 100 dollars. Could be a wick lower but not too confident. There is quite a bit of strength in Litecoin, and for good damn reason.
Not financial advice just my opinion. Thank you

LTC vs ETH : Bottom ? Hello:
Good ? me no or yes.
ETH vs LTC.
Eth is good but LTC ? LTC is a giant which sleep.
The chart show us a possible H&S pattern inverted.
My view is something like it.
If you want be safe, enter when red line is break.
GL

Litecoin Rebounds Off Trendline in Bullish Continuation SetupFenzoFx—Litecoin rebounded from the ascending trendline, a demand zone supported by the VWAP from July 25th.
Immediate resistance stands at $114.3. A close above this level may resume the bullish trend, potentially targeting previous highs near $114.3.

Litecoin - Expecting Bullish Continuation In The Short TermH4 - We have a clean bullish trend with the price creating a series of higher highs, higher lows structure.
This strong bullish momentum is followed by a pullback.
No opposite signs.
Until the two Fibonacci support zones hold I expect the price to move higher further.
If you enjoy this idea, don’t forget to LIKE 👍, FOLLOW ✅, SHARE 🙌, and COMMENT ✍! Drop your thoughts and charts below to keep the discussion going. Your support helps keep this content free and reach more people! 🚀
--------------------------------------------------------------------------------------------------------------------

Litecoin Retests $112.3 Support Amid Bullish MomentumLitecoin remains bullish above the 50-day SMA, supported by an ascending trendline. As of now, LTC trades near $113.0, retesting this area as support. A sustained hold above the trendline could initiate another bullish leg, targeting resistance at $130.3.
However, a close and stabilization below the trendline would invalidate this outlook and suggest increased selling pressure.

Trading balanceTrading balance The price of the asset has rebounded from the balance zone. With the prospect of growth into the resistance zone.

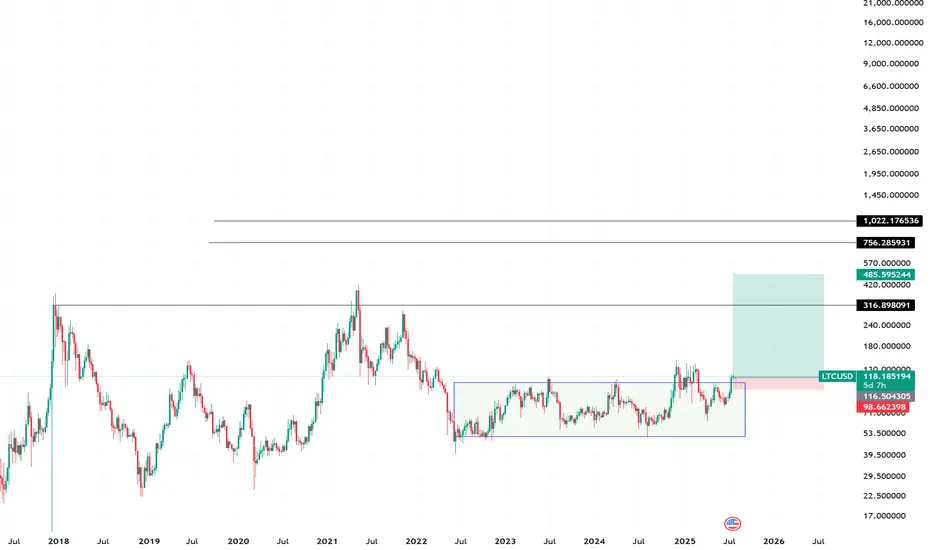
Litecoin Bull cycle3 years of range accumulation between 100 and 50 dollars is ending. It appears to be making a break and the first real resistance seems to be $350 imo.
It looks prime for a massive expansion xrp style, if it goes beyond $484, it could continue to 750 and 1k.
Follow the trend.
LTCUSD: The Trade Everyone ForgotLTCUSD: The Trade Everyone Forgot — But the Chart Didn’t
While everyone’s watching ETH and BTC chase headlines, NYSE:LTC is quietly breaking out of a 2-month range — and the math is hard to ignore.
🎯 Setup Breakdown
Base Breakout: Litecoin just cleared a horizontal range that’s held it hostage since May.
MACD: Fresh bullish crossover with expanding histogram — early momentum shift after a long cooldown.
Ichimoku: Price is above the cloud with Tenkan and Kijun crossing. Bullish structure with a cushion of support below.
📊 Trade Specs
Entry: ~$94
Target: $129.39 (+36.18%)
Stop: $85 (–9.38%)
R/R: 3.86 — almost 4:1
⚠️ What Makes It Different?
Sentiment: Nobody’s talking about Litecoin. That’s usually when it moves.
Structure: This isn’t chasing green candles — this is defined consolidation + confirmed breakout.
Asymmetry: With nearly 4:1 R/R, even a 25–30% win rate keeps you in the green if managed well.
Sometimes the quiet charts are the loudest in hindsight.
Are you in NYSE:LTC or still watching?

LTC Litecoin Short Term Pull Back Quick and SharpI believe Litecoin Is topping out on the 2 hour. Looks like we may come back down and tap support at around 104 but I wouldn't be surprised a wick hits 100. I have buy orders around 103-106. I am not super confident on a deeper pullback so thats why my buys are there is so i don't miss the dip. Id rather make a little less money than miss a buy in trying to nail the bottom. Litecoin is starting its breakout from a 7 year consolidation and accumulation phase. This should be pretty massive. Litecoin is going to benefit considerably from these new bills that are being signed and many of the favorites in the top 100 will soon disappear!
The time for Litecoin to shine as I have been talking about for years is now. I am almost certain that this is that time. My predictions all still hold if you would like to go read them. I was just off on timing. Timing is the hardest thing to predict especially with how wild this planet has been lately. None of this is financial advice its just my opinion.
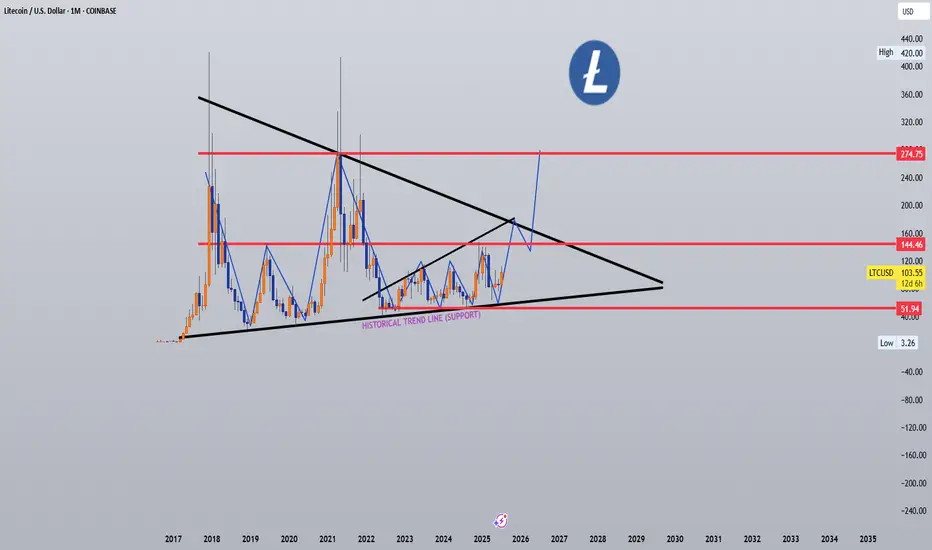
LTC (the most dangerous chart in crypto)LTC / USDT
8 years of accumulation in this triangle and price is being squeezed around apex.. What is the result of this long accumulation?
It reminds me of XRP chart before the big breakout in last November
Keep an eye of it…

LTCUSD sell 131.2On the daily chart, LTCUSD stabilized and moved upward. Currently, we can pay attention to the resistance near 113.2 above. This position is a potential short-selling position for the bearish bat pattern, and this position is in the previous supply area.

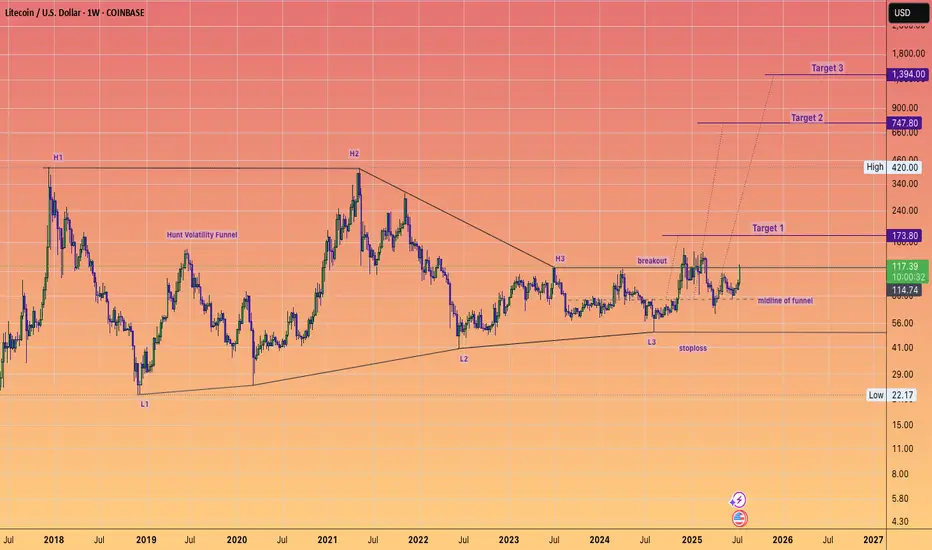
Litecoin has maintained it's HVF and can STILL do a 10X...in the coming years.
This is a massive pattern formed over 7 years and I expect over performance of target 3 ultimately.
The day to week price action really does not matter when you have beautiful setups like this.
Keep stacking at these low prices.
@TheCryptoSniper
LTC Buy Zones + ETF Angle – Legacy Coin Prepping for Breakout?📌 Coin: LTC (Litecoin)
💰 Buy Levels:
✅ First Entry: $104
✅ Second Entry: $92
✅ Third Entry: $85
🛑 Panic / SL Level: Weekly close back below $70
🧠 Fundamental Analysis (FA) – In Short
*️⃣ Sector: Layer 1 / Payments
*️⃣ Use Case: Litecoin is a peer-to-peer digital cash system with fast, low-fee transactions — often called the “silver to Bitcoin’s gold.”
*️⃣ Tech: Fork of Bitcoin with 2.5-minute block time, SegWit enabled, and MimbleWimble extension blocks for optional privacy.
*️⃣ Adoption: One of the most widely integrated payment coins globally — supported on PayPal, BitPay, Binance Pay, and thousands of retailers.
*️⃣ Narrative Fit: Legacy coin with institutional familiarity. Often used as a BTC testbed (e.g. SegWit, Lightning). Still thrives in payment utility narratives.
📊 Tokenomics & Market Data
(As of mid-July 2025)
🪙 Current Price: ~$96
🧾 Market Cap: ~$7.1B
🔢 Rank: Top 25
🧮 Circulating Supply: ~74M LTC
🔒 Max Supply: 84M LTC (fixed)
🔥 Halving Cycle: Every ~4 years (next in 2027), last halving was in August 2023
🛠️ Security: Proof of Work, Scrypt-based (ASICs supported)
🎯 Bull Market Target (Realistic)
Target Range: $180 – $240
*️⃣ Based on previous cycle behavior and historical ratios to Bitcoin.
🚀 Mega Bullish Target (Speculative Top)
Target Range: $300 – $420+
*️⃣ If Litecoin reclaims a major role in cross-border payments or benefits from Bitcoin ETF / institutional spillover.
✅ Final Take
🧠 LTC remains a legacy coin with strong brand trust, fixed supply, and real-world payment utility.
Your entries are deep in macro range, and the $70 SL gives clear invalidation under 2023 breakout structure.
While it won’t 50x like small caps, it often outperforms in early alt rotations and benefits from conservative investor flows.
We ask Allah reconcile and repay
LTC/USD LITECOIN Adam & Eve Pattern On WeeklyThe Adam and Eve pattern is quite effective and usually signals a trend change to bullish. Once this pattern breaks the neckline I think its straight to $200 before any sort of pullback.
Haven't done a chart in a while cause its been the same old stuff, sideways. We are starting to ignite now. Silver is running which means something is breaking in the background financial system. I see the biggest blow off top you've ever seen coming, its the only way out of this, print print print until it doesn't work anymore.
Also I was reading that Bitcoin is removing its cap for spam in each block in October? This could spell disaster for fees and congestion. Litecoin will skyrocket during that time I believe because the fees will be so high it will price out the little guy trying to send a grand or two. I see an influx of people coming to Litecoin. Good luck , none of this is financial advice just my opinion

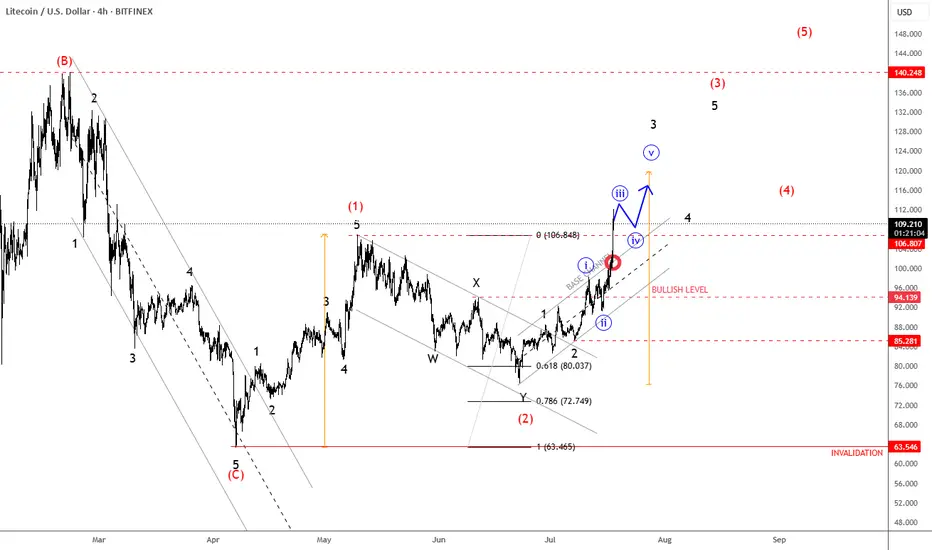
Litecoin Continues Its Bullish Cycle As ExpectedLitecoin Continues Its Bullish Cycle As Expected, which can send the price even higher from technical point of view and by Elliott wave theory.
We talked about Litecoin back on May 30, when we spotted a bullish setup formation with waves (1) and (2) that can extend the rally within wave (3) of a five-wave bullish impulse.
As you can see today on July 18, Litecoin with ticker LTCUSD is now breaking strongly back above May highs after we noticed a complex W-X-Y correction in wave (2). Now that ALTcoin dominance is stepping strongly in, we may easily see more gains within a projected five-wave bullish cycle during the ALTseason, just be aware of short-term pullbacks.
LTCUSD – Winding for BreakoutLTC rallied from $89 to just over $101.50 in a volatile swing. The structure shows bullish compression with higher lows forming beneath $101. A push through $101.80–$102 would likely initiate a fast breakout toward $104+. Bearish only if price breaks $98.80.
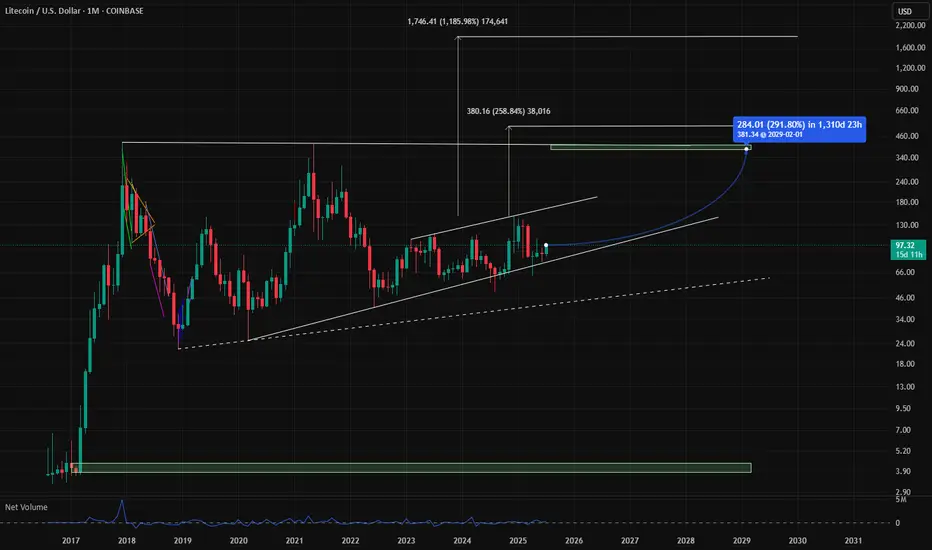
LTC Targets 400$ + 1900$ Litcoin LTC Targets for the next run are atm +290% is a realistic szenario. The addvanced targets at 1900$ are very impressiv but remember there are only 21 Mio. Coins too, like BTC because it is the fork and think about an alternative payment methode like btc, would be a reason for 1900$ pro LTC. So in Crypto is nothing unreal if you could imagine, but first of all approx. 400$ are a good direction. GM
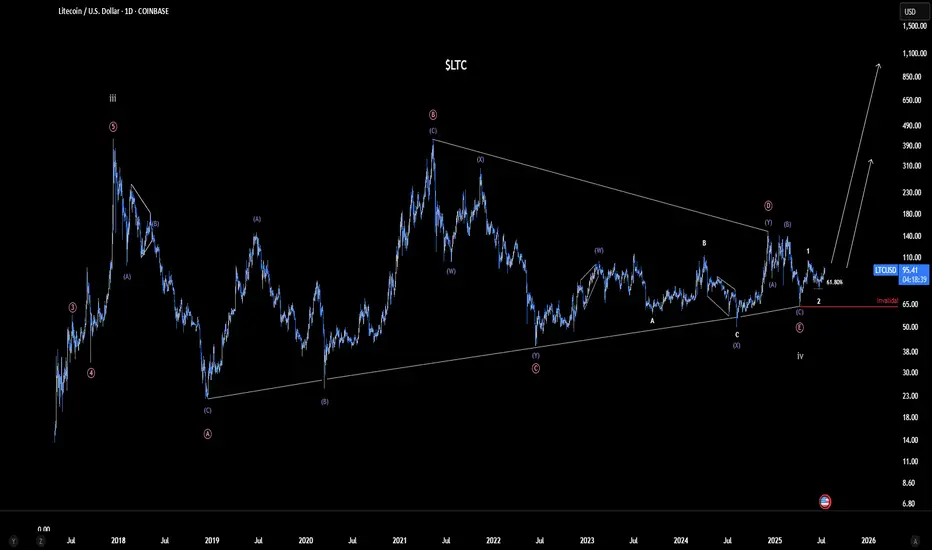
Litecoin (LTC) - $1000 Target Hype or Reality? | Ew analysisLitecoin may be on the verge of a breakout following nearly four years of accumulation. From a technical standpoint, this could lead to a powerful rally toward targets in the $600–$1000 range. However, the timing of this Wave 4 consolidation don’t align particularly well with a typical, healthy correction. A break below the red line would invalidate the current count and shift focus to my secondary outlook.
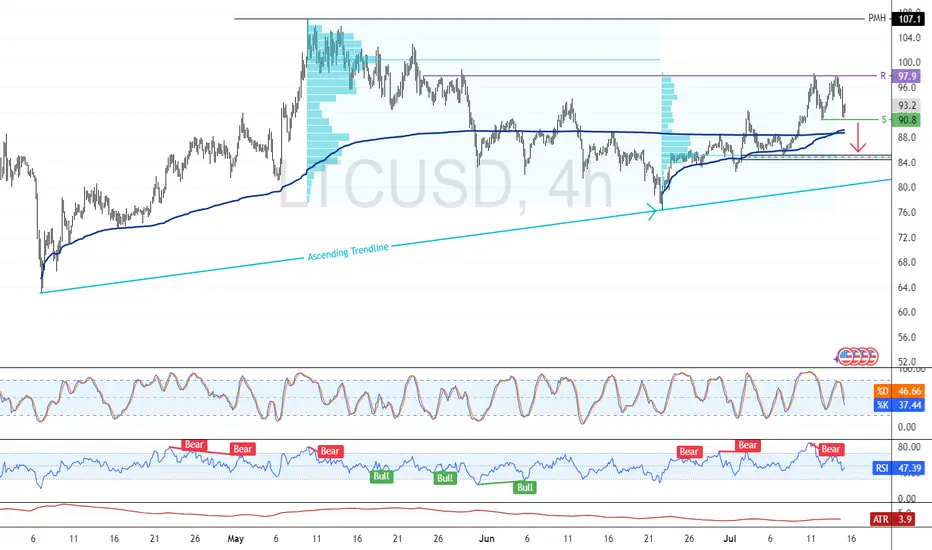
Litecoin: Volume-Heavy Resistance Caps RecoveryFenzoFx—Litecoin fell 2.50% today, forming a double bottom at $90.80. If bears stabilize the price below this level, the decline could extend toward $85.20 support.
Resistance at $97.90 aligns with a high volume zone, reinforcing bearish pressure and making a breakout challenging.