Litecoin (LTCUSD) – A Massive Move Brewing? 1350$ Target Aligns Litecoin has been consolidating in a symmetrical triangle for nearly a decade on the macro 6M chart. Despite recent price weakness, the structure remains bullish. The triangle’s apex is nearing, and historically, such long-term squeezes lead to explosive moves.
Here’s the interesting part:
If we project the distance from the triangle’s base to its tip onto a breakout point (end of triangle), the target aligns perfectly with the 3.618 Fibonacci extension, which is around $1350.
This isn’t just a random number — it implies a market cap of around $100B for Litecoin, which is absolutely imaginable in a scenario where:
• Bitcoin reclaims its ATH,
• BTC dominance declines (altseason begins),
• and sentiment shifts risk-on for large-cap alts.
⸻
Fundamentals Supporting the Move:
• MWEB (MimbleWimble Extension Block): Adds optional privacy and fungibility.
• ETF speculation & recognition by major institutions like Grayscale and Fidelity.
• Payment use cases remain strong – LTC is still one of the most used coins for transactions.
• Memetic potential: The rise of meme culture can shift retail attention quickly.
• Historical correlation with BTC cycles.
⸻
Technicals:
• Price respecting triangle structure
• Holding macro higher lows
• Fibonacci levels show confluence with projected breakout
• RSI hovering in neutral zone – lots of room for upside
• Low volume suggests coiling pressure building up
⸻
Key Levels:
• Support: $65–70 zone (bottom of triangle)
• Resistance/Breakout Trigger: ~$140
• Fibonacci Targets:
• 0.618: $255
• 1.618: $630
• 3.618: $1350
⸻
Potential LTC/BTC Ratio:
If LTC hits $1350 and BTC retests ATH, that gives LTC/BTC a ratio of 0.01, a historic level and psychological milestone.
⸻
Conclusion:
All eyes on this triangle. Fundamentals are aligning with technicals. If the bull market resumes and BTC dominance breaks down, Litecoin is poised for a breakout that could surprise many.
Let the triangle decide. 🚀
LITECOIN trade ideas

LITECOIN to new highs, fib retracement completeLitecoin - officially a commodity as declared by the SEC - is about to hit major support and if it holds, which it most likely will, it is going to go to new highs as it is intended to.
Not financial advice, simply looking at trendlines and following fundamentals.
DYR

LTC is Bearish Below $80.0: What's Next?FenzoFx—Litecoin slipped below $76.4 and is currently testing this level as support. With bearish momentum stemming from $80.0, the market outlook remains bearish while the price stays below this threshold.
>LTC/USD may target $71.00 next, and selling pressure could drive it further down to $64.45.
>A bullish shift would require a break above $80.0, paving the way toward $88.50 resistance.
>>> No Deposit Bonus
>>> %100 Deposit Bonus
>>> Forex Analysis Contest
All at F enzo F x Decentralized Forex Broker

LTC: The 8 Years Long Triangle#LTC has been forming a corrective triangle since 2017. Price action from 2022 to now indicates the triangle is nearing completion, which indicates a nearing bullish breakout.
Even a dip below $50 wouldn’t invalidate the setup, as long as the triangle holds.
#Litecoin

Bearish Trend Persists: Litecoin Targets $71.0FenzoFx—Litecoin is trading at $75.9 after closing below $76.4 and testing it as resistance. The Stochastic Oscillator signals oversold conditions, suggesting a possible price bounce, although the bearish trend persists below $80.0.
If the bearish momentum continues, the next target could be $71.0.
Alternatively, stabilization above $80.0 may extend gains toward $88.5.
>>> No Deposit Bonus
>>> %100 Deposit Bonus
>>> Forex Analysis Contest
All at F enzo F x Decentralized Forex Broker

ltcusdive taken a similar idea before and this one looks exactly the same ,history repeating itself!!!
beautiful

LTCUSD INTRADAY oversold bounce back capped at 880,00Market Sentiment:
The prevailing trend for LTCUSD remains bearish, with the recent price action appearing to be an oversold bounce rather than a sustained recovery.
Key Levels:
Resistance: 880.00 (Previous consolidation zone)
Support Levels: 672.60 followed by 630.20 and 577.50
Potential Scenarios:
Bearish Continuation: If LTCUSD fails to break above 800.00 and faces rejection, it could resume its downtrend, targeting 672.60 initially, followed by 630.20 and 577.50 over the longer term.
Bullish Breakout: A confirmed breakout and daily close above 800.00 would shift the sentiment bullish, paving the way for a rally toward 933.00 and potentially 975.00.
Conclusion:
LTCUSD remains in a bearish structure unless a breakout above 800.00 is confirmed. Until then, price action suggests that any rally is likely to be a short-term relief within a broader downtrend.
This communication is for informational purposes only and should not be viewed as any form of recommendation as to a particular course of action or as investment advice. It is not intended as an offer or solicitation for the purchase or sale of any financial instrument or as an official confirmation of any transaction. Opinions, estimates and assumptions expressed herein are made as of the date of this communication and are subject to change without notice. This communication has been prepared based upon information, including market prices, data and other information, believed to be reliable; however, Trade Nation does not warrant its completeness or accuracy. All market prices and market data contained in or attached to this communication are indicative and subject to change without notice.

Litecoin Set Up For Massive Move LTCUSD A chart showing a big move along the lower band of this overarching channel
I expect price to come near or hit $1000 which moves well with the previous ATH in 2017/18
Sleeping giant

LTC's Bullish Momentum Eased at $80.0FenzoFx—Litecoin's uptrend eased at the $80.0 resistance level. A close above this resistance could trigger the uptrend, targeting $88.5.
The support is at $76.4.
>>> $1,600 prize pool > Join FenzoFx Forex Analysis Contest

LTC/USD "LiteCoin vs US Dollar" Crypto Heist (Scalping / Day)🌟Hi! Hola! Ola! Bonjour! Hallo! Marhaba!🌟
Dear Money Makers & Robbers, 🤑 💰💸✈️
Based on 🔥Thief Trading style technical and fundamental analysis🔥, here is our master plan to heist the LTC/USD "Lite Coin vs US Dollar" Crypto Market. Please adhere to the strategy I've outlined in the chart, which emphasizes long entry. Our aim is to escape near the high-risk MA Zone. Risky level, overbought market, consolidation, trend reversal, trap at the level where traders and bearish robbers are stronger. 🏆💸"Take profit and treat yourself, traders. You deserve it!💪🏆🎉
Entry 📈 : "The heist is on! Wait for the MA breakout (80.00) then make your move - Bullish profits await!"
however I advise to Place Buy stop orders above the Moving average (or) Place buy limit orders within a 15 or 30 minute timeframe most recent or swing, low or high level for pullback entries.
📌I strongly advise you to set an "alert (Alarm)" on your chart so you can see when the breakout entry occurs.
Stop Loss 🛑: "🔊 Yo, listen up! 🗣️ If you're lookin' to get in on a buy stop order, don't even think about settin' that stop loss till after the breakout 🚀. You feel me? Now, if you're smart, you'll place that stop loss where I told you to 📍, but if you're a rebel, you can put it wherever you like 🤪 - just don't say I didn't warn you ⚠️. You're playin' with fire 🔥, and it's your risk, not mine 👊."
📍 Thief SL placed at the recent/swing low level Using the 3H timeframe (72.00) Scalping/Day trade basis.
📍 SL is based on your risk of the trade, lot size and how many multiple orders you have to take.
🏴☠️Target 🎯: 88.00 (or) Escape Before the Target
💰💵💸LTC/USD "LiteCoin vs US Dollar" Crypto Market Heist Plan (Day / Scalping Trade) is currently experiencing a bullishness,., driven by several key factors.👇👇👇
📰🗞️Get & Read the Fundamental, Macro, COT Report, On Chain Analysis, Sentimental Outlook, Intermarket Analysis, Future trend targets.. go ahead to check 👉👉👉🔗
⚠️Trading Alert : News Releases and Position Management 📰 🗞️ 🚫🚏
As a reminder, news releases can have a significant impact on market prices and volatility. To minimize potential losses and protect your running positions,
we recommend the following:
Avoid taking new trades during news releases
Use trailing stop-loss orders to protect your running positions and lock in profits
💖Supporting our robbery plan 💥Hit the Boost Button💥 will enable us to effortlessly make and steal money 💰💵. Boost the strength of our robbery team. Every day in this market make money with ease by using the Thief Trading Style.🏆💪🤝❤️🎉🚀
I'll see you soon with another heist plan, so stay tuned 🤑🐱👤🤗🤩

LTCUSD Bullish Reversal in Progress? Key Levels to WatchLitecoin (LTCUSD) is showing early signs of a potential bullish reversal after bouncing off a strong demand zone around $70–$76 (highlighted in orange). Here's a breakdown of the technical setup:
Key Technical Zones:
Support Zone: $70–$76 (High Volume Node + Demand Area)
Resistance 1: $81.27 – Immediate resistance that could turn into support if broken.
Resistance 2: $104.79 – A key level to watch if momentum continues.
Supply Zone: $116.73 – $131.03 (Marked by heavy previous selling pressure)
Bullish Signals:
Price has tested the demand zone multiple times and held, indicating strong buyer interest.
LTC is now pushing above the lower consolidation zone, aiming for the $81.27 resistance.
Volume around this area is tapering, which could lead to a breakout rally if bulls maintain control.
Trade Idea:
Aggressive Entry: On a confirmed 4H candle close above $81.27.
Conservative Entry: Wait for a retest of $81.27 as support with bullish confirmation.
Targets: $104.79 short-term, $116–$131 longer-term.
Stop Loss: Below $75 support zone to manage risk.
Outlook:
If bulls manage to break and hold above $81.27, Litecoin could enter a mid-term rally toward the $100–$130 zone. However, failure to hold current levels might push price back to retest the demand zone.
Let me know your thoughts – are you bullish or bearish on LTC this month?
#Litecoin #LTCUSD #Crypto #Altcoins #TechnicalAnalysis #TradingView #SupplyAndDemand #LuxAlgo

Litecoin Is An Absolute Bargain Right NowFrom a technical perspective, the recent reaction at the lower trendline of the parallel channel since 2016 has been respected many times, and once again, it has held.
I anticipate that the price will explode in the next several months. We just need to be patient and wait for the Fed to pivot their monetary policy, and then cryptocurrencies will soar. Global liquidity has been rising, which is positive for cryptocurrencies. My prediction is that in May, we will finally start to see some significant bullish price movement, and this trend will continue for many months thereafter. Stay patient.
Let me know what you think.
Best regards.

Look for Buys on litecoin at bottomHello,
The most common advice given to new investors is to "buy low and sell high." While this sounds simple, it’s one of the hardest strategies to execute due to the psychological challenges of investing. Emotions like fear and greed often override rational decision-making, leading many to act against their best interests.
Why does this happen? Greed drives investors to buy at market peaks, chasing the belief that prices will continue to rise indefinitely—yet markets rarely sustain upward momentum forever. Conversely, fear prompts selling at the bottom, as investors panic and assume prices will keep falling. This behavior causes them to miss out on both profit-taking opportunities and long-term growth potential.
Taking Litecoin as an example. As shown in the chart, it has been consolidating near its bottom for over 1,000 days. Buying at this level could be a strategic move, offering the potential for gains exceeding 700% in the long run. Investors looking to buy can position themselves for buys at around $600. Our long-term target for this coin is $3,000.
Disclosure: I am part of Trade Nation's Influencer program and receive a monthly fee for using their TradingView charts in my analysis.

Litecoin LTCUSD Completing Final Leg Down Before LaunchAs you can see Litecoin is forming a very similar pattern. I think the rest of March will be corrective. Litecoin will likely come down and bounce off the trend line which coincidental also is a major support level. April will be slightly bullish, May and June will be majorly bullish which I believe Bitcoin will also fly up to 140k as well in this time. I believe Litecoin will outperform the majority of the market. Major hyperinflation will begin this summer which will be very positive for crypto. Many cryptos will die in this hyperinflation period. Only some will survive. Dollar is going to crash. Get ready for a wild ride into 2026. People calling for a bear market are ill informed and will kick themselves for selling. This is the beginning of the biggest run in some cryptos, we've ever seen. Buckle up. Good luck. Not financial advice.

Litecoin big fall commenced to $49 thanks to RumpThe operational costs are rising sky high for Litecoin which is becoming very expensive to mine.
And based on the Crypto Depression, it seems like there is more downside to come for the alt coin due to some of the following:
📉 Weak On-Chain Activity
Fewer active wallets and transactions lately—shows low interest.
🔻 Bearish Price Action
LTC just broke key support levels on the chart—bad sign for bulls.
💼 Lack of Big Investor Moves
No major whale activity—institutions are sitting this one out.
📉 ETF Hype Fading
Talk of a Litecoin ETF has cooled off—momentum’s dying down.
Technicals also look bad including:
Inv Cup and Handle
Price<20 and 200
Target $49.60
Disclosure: I am part of Trade Nation's Influencer program and receive a monthly fee for using their TradingView charts in my analysis.

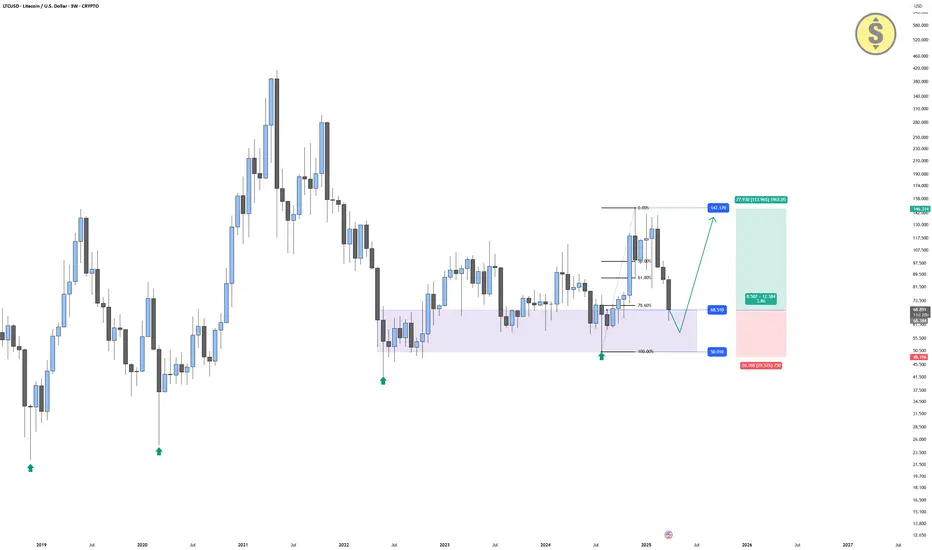
Buyers might be waking up in the Litecoin zoneOn the COINBASE:LTCUSD 3W chart, price has dropped into a wide demand zone between 68 and 50, an area that has provided strong support in the past. This drop aligns with the 78.6 Fibonacci retracement of the last bullish leg, suggesting that long term buyers might soon show interest. As long as price stays above 50, the structure remains favorable for a possible reversal. A strong bullish reaction from this zone, followed by confirmation on lower timeframes or a reclaim of the 68 level, could signal a move toward the 147 target. This setup offers a solid long term opportunity with a favorable risk to reward ratio.
Disclaimer: This content is for educational and informational purposes only. It does not represent financial advice or a recommendation to buy or sell any financial instrument. Trading involves risk, and you should only trade with money you can afford to lose.
LTCUSD bearish continuation “Gap Close” resistance at 800.70Market Sentiment:
The prevailing trend for LTCUSD remains bearish, with the recent price action appearing to be an oversold bounce rather than a sustained recovery.
Key Levels:
Resistance: 897.70 (Previous consolidation zone)
Support Levels: 826.80 → 790.20 → 746.40
Potential Scenarios:
Bearish Continuation: If LTCUSD fails to break above 800.70 and faces rejection, it could resume its downtrend, targeting 631.10 initially, followed by 598.60 and 520.00 over the longer term.
Bullish Breakout: A confirmed breakout and daily close above 800.70 would shift the sentiment bullish, paving the way for a rally toward 885.00 and potentially 927.00.
Conclusion:
LTCUSD remains in a bearish structure unless a breakout above 800.70 is confirmed. Until then, price action suggests that any rally is likely to be a short-term relief within a broader downtrend.
This communication is for informational purposes only and should not be viewed as any form of recommendation as to a particular course of action or as investment advice. It is not intended as an offer or solicitation for the purchase or sale of any financial instrument or as an official confirmation of any transaction. Opinions, estimates and assumptions expressed herein are made as of the date of this communication and are subject to change without notice. This communication has been prepared based upon information, including market prices, data and other information, believed to be reliable; however, Trade Nation does not warrant its completeness or accuracy. All market prices and market data contained in or attached to this communication are indicative and subject to change without notice.

Bearish Litecoin Found SupportFenzoFx—Litecoin trades bearish below $84.0 with possible correction near this level. Watch for a bearish candlestick pattern to join the bears.

Litecoin (LTC) Breaks Key Support – Bears Eye Next Major SupportLitecoin (LTC) has taken a sharp bearish turn as the latest monthly close fell decisively below the critical $97.12 support level. This breakdown signals a major shift in market sentiment, reinforcing the downside risks for the cryptocurrency. As broader market conditions remain uncertain, Litecoin now faces the possibility of further downside momentum, with the next significant support level resting at $57.70.
Bearish Outlook Strengthens
The monthly candlestick chart confirms a significant rejection from recent highs, forming a strong red candle that suggests continued selling pressure. The break below $97.12, a long-standing support level, paves the way for deeper losses and a potential retest of lower support zones. The technical landscape remains in favor of the bears, raising concerns over Litecoin’s short-term recovery prospects.
Why the Bears Are in Control
Several key factors contribute to Litecoin’s bearish momentum:
Technical Breakdown: The confirmed close below $97.12 eliminates a crucial demand zone, turning it into new resistance. This breakdown invalidates previous bullish attempts to reclaim higher ground, making the path of least resistance to the downside.
Momentum Shift: The failure to sustain prices above the critical level of $132.36 had indicated weakening bullish strength and a potential continuation of the downtrend.
Market Conditions: Broader cryptocurrency market weakness, declining investor confidence, and risk-averse trading behavior have compounded the selling pressure on Litecoin.
Price Targets
Immediate Resistance: $97.12 (now acting as resistance)
Bearish Target: $57.70 (next major key support level)
As Litecoin struggles to find support, traders should watch for potential relief bounces, which may provide short-term selling opportunities before the next major leg down. If bearish momentum persists, a move toward $57.70 could materialize in the coming weeks.
Litecoin’s Technology and Vision: Is There Still Hope?
Despite its current technical struggles, Litecoin remains one of the most well-established cryptocurrencies in the market. Created in 2011 by Charlie Lee, Litecoin was designed as a faster and more efficient alternative to Bitcoin. Often referred to as the “silver to Bitcoin’s gold,” Litecoin has continued to evolve over the years, maintaining its relevance in the industry through continuous upgrades and improvements.
Key Technological Features
Faster Transactions: Litecoin’s block generation time is 2.5 minutes, significantly faster than Bitcoin’s 10-minute blocks. This allows for quicker transaction confirmations and improved usability for everyday payments.
Low Transaction Fees: Litecoin offers a cost-effective way to transfer value compared to Bitcoin, making it attractive for microtransactions and cross-border payments.
Security and Decentralization: Utilizing the Proof-of-Work (PoW) consensus mechanism with the Scrypt hashing algorithm, Litecoin remains secure and resistant to attacks while offering more efficient mining options.
Integration of MimbleWimble: Litecoin has integrated MimbleWimble, a privacy-enhancing technology that improves fungibility and scalability while ensuring confidential transactions.
Litecoin’s Long-Term Vision
Litecoin continues to push forward with its goal of becoming a leading digital payment solution. The Litecoin Foundation has actively worked on merchant adoption, partnerships, and technical enhancements to improve scalability and usability. Despite current market conditions, the project remains committed to advancing cryptocurrency adoption and serving as a viable alternative for digital transactions.
However, technical challenges and bearish sentiment in the market have overshadowed Litecoin’s fundamental strengths. While the technology remains robust, price action continues to be dictated by broader market sentiment, making it essential for traders to monitor key technical levels.
Conclusion
Litecoin’s recent breakdown below $97.12 marks a crucial turning point in its price action. While the long-term vision and technological advancements remain intact, the immediate outlook leans bearish, with the next major support level at $57.70. Traders should remain cautious, watching for potential relief rallies that could provide opportunities for re-entry before further downside.

Trading balanceTrading balance The price of the asset has rebounded from the balance zone. With the prospect of growth into the resistance zone.
#LTCUSD #Signals #Tramp
LTC breaking down - bad news for the crypto market- for the past three months, Litecoin has been forming an extremely clear daily range
- now trading below range low and, furthermore, range low has been re-tested and rejected as resistance
- target almost 40% lower which implies a strong downside move is around the corner for the entire crypto market

LTCUSD Litecoin OH NO TARIFFS! Everyone SELL NOW!The market reacted to the tariffs negatively as expected. I don't think these tariffs will last long. Countries will cave and remove their tariffs. Bottom line is they need us more than we need them. Once global free and easier trade starts you're going to see a boom cycle like never before. This is the bottom and the beginning of the biggest bull run you'll ever see. I don't get involved in politics but this move that Trump made with the tariffs is going to be a major positive for the USA and the world moving forward. This isnt 1929, we live in a much more advanced world now. Collapses and depressions are a thing of the past in my opinion.
As for Litecoin I see it coming down to test around $70 dollars by the middle of April. This is also timed almost perfectly to the 2017 run Litecoin had, coincidentally trump was starting his first term in 2017 as well. Also timed perfectly to when tax day is over for USA.
Many have capitulated and sold everything thinking a giant recession is coming, or a war, or a collapse, or aliens, or you name it people are scared of their own shadows lately. Like a plague of Grackles where one gets spooked and the whole lot of them get scared and take off when they dont even know why. This is how the markets work though, most will make the wrong decision so the few who made the right decision can profit from their mistakes. Once the market starts to run again those who sold will think its just a fake pump or dead cat bounce and wont buy in. Then the market will continue to rise and rise and finally when its near an all time high those who capitulated and sold early will fomo back in and buy the top to provide liquidity for those who were called crazy for buying the bottom. Its a cycle thats been happening since markets started.
So Im sticking with my predictions for Litecoin, I am not falling for this bear trap crap. Im doubling down. This is not financial advice. This is just my opinion.
LTC/USD "Litecoin vs U.S.Dollar" Crypto Heist (Scalping/Day)🌟Hi! Hola! Ola! Bonjour! Hallo! Marhaba!🌟
Dear Money Makers & Thieves, 🤑 💰🐱👤✈️
Based on 🔥Thief Trading style technical and fundamental analysis🔥, here is our master plan to heist the LTC/USD "Litecoin vs U.S.Dollar" Crypto market. Please adhere to the strategy I've outlined in the chart, which emphasizes long entry. Our aim is the high-risk Yellow MA Level. Risky level, overbought market, consolidation, trend reversal, trap at the level where traders and bearish robbers are stronger. 🏆💸"Take profit and treat yourself, traders. You deserve it!💪🏆🎉
Entry 📈 : "The heist is on! Wait for the MA breakout (85.00) then make your move - Bullish profits await!"
however I advise to Place Buy stop orders above the Moving average (or) Place buy limit orders within a 15 or 30 minute timeframe most recent or swing, low or high level after the MA breakout.
📌I strongly advise you to set an "alert (Alarm)" on your chart so you can see when the breakout entry occurs.
Stop Loss 🛑: "🔊 Yo, listen up! 🗣️ If you're lookin' to get in on a buy stop order, don't even think about settin' that stop loss till after the breakout 🚀. You feel me? Now, if you're smart, you'll place that stop loss where I told you to 📍, but if you're a rebel, you can put it wherever you like 🤪 - just don't say I didn't warn you ⚠️. You're playin' with fire 🔥, and it's your risk, not mine 👊."
📌Thief SL placed at the nearest/swing low or high level Using the 30m timeframe (81.00) Day trade basis.
📌SL is based on your risk of the trade, lot size and how many multiple orders you have to take.
Target 🎯:
✂Primary Target - 88.70
✂Secondary Target - 93.00
LTC/USD "Litecoin vs U.S.Dollar" Crypto Market Heist Plan (Day / Scalping Trade) is currently experiencing a bullishness,., driven by several key factors.👇
📰🗞️Get & Read the Fundamental, Macro, COT Report, On Chain Analysis, Sentimental Outlook, Intermarket Analysis, Future trend targets.. go ahead to check 👉👉👉🔗
⚠️Trading Alert : News Releases and Position Management 📰 🗞️ 🚫🚏
As a reminder, news releases can have a significant impact on market prices and volatility. To minimize potential losses and protect your running positions,
we recommend the following:
Avoid taking new trades during news releases
Use trailing stop-loss orders to protect your running positions and lock in profits
💖Supporting our robbery plan 💥Hit the Boost Button💥 will enable us to effortlessly make and steal money 💰💵. Boost the strength of our robbery team. Every day in this market make money with ease by using the Thief Trading Style.🏆💪🤝❤️🎉🚀
I'll see you soon with another heist plan, so stay tuned 🤑🐱👤🤗🤩
