LNKUSD trade ideas

$LINK - HEADING TO OUR TARGET.$LINK - HEADING TO OUR TARGET.
This Gray Box is a Demand Zone from the Weekly Chart.
I will be loading up on Chainlink big time in the $3.50- $4.50 area.
Do you hold any Chainlink?
#LINK

LINKUSD D1: 30%+ CORRECTION WARNING TP 4.00(SL/TP)(NEW)Why get subbed to me on Tradingview?
-TOP author on TradingView
-2000+ ideas published
-15+ years experience in markets
-Professional chart break downs
-Supply/Demand Zones
-TD9 counts / combo review
-Key S/R levels
-No junk on my charts
-Frequent updates
-Covering FX/crypto/US stocks
-before/after analysis
-24/7 uptime so constant updates
🎁Please hit the like button and
🎁Leave a comment to support our team!
LINKUSD D1: 30%+ CORRECTION WARNING TP 4.00(SL/TP)(NEW)
IMPORTANT NOTE: speculative setup. do your own
due dill. use STOP LOSS. don't overleverage.
🔸 Summary and potential trade setup
::: LINKUSD daily/candle chart review
::: 30% CORRECTION WARNING
::: updated/revised outlook
::: distribution in range / weak chart
::: limited upside / expect dump from HIGHS
::: weakness will last for 4-8 weeks
::: LOG SCALE chart
::: backtested wedge breakout
::: RISING WEDGE BEARS taking over
::: FTX/ FTT bankruptcy will pull crypto down
::: CLEAN REJECTION AT recent highs
::: S/R was re-tested produced WEAK bounces
::: final BOUNCE possible now before DUMP
::: also noteworthy sequence of lower highs
::: recommended strat: MARKET SHORT IT
::: final TP BEARS is 4.00/4.20 usd
::: 40-45% correction possible next
::: 4-8 weeks in November/December 2022
::: right now no upside in this market
::: position traders should wait for
::: better entry prices later after
::: no upside in this market it's game over
::: recommended strategy: SHORT SELL AT MARKET
::: TP BEARS is +40% gains - near 4.00 USD
::: BULLS stay out until correction is over
::: SWING TRADE: SHORT/HOLD IT
::: correction run not over yet
::: good luck traders!
::: BUY and get paid. period.
🔸 Supply/Demand Zones
::: N/A
::: N/A
🔸 Other noteworthy technicals/fundies
::: TD9 /Combo update: N/A
::: Sentiment mid-term: BEARS/CORRECTION/40%
::: Sentiment short-term: DUMP/GAMEOVER
RISK DISCLAIMER:
Trading Crypto, Futures , Forex, CFDs and Stocks involves a risk of loss.
Please consider carefully if such trading is appropriate for you.
Past performance is not indicative of future results.
Always limit your leverage and use tight stop loss.

LINK: back on old trackA lot of negative news on the market during the previous week, related to FTX contingencies and recession in the US in the coming year, pushed the price of LINK to the downside and lowest weekly level at $5.8. Based on current charts it doesn’t seem that the support line at $6.0 has been broken, but it seems that it has been tested to the downside during the last two days. This is generally positive for LINK, because it shows that even in a stressful time, investors sustain confidence in this coin.
With latest price moves to the downside, RSI reached level of 34, but indicator still did not reach the clear oversold side of the market. Moving averages of 50 and 200 days continue to move as two parallel lines with tiny differences between them, still holding the probability that a potential cross might come in the near future.
As per current charts, it could be expected for LINK to enter into a short reversal, after not being able to clearly break the support line at $6.0. Considering quite low daily trading volumes, it should not be expected to make significant moves in price. There is probability for $6.5 short resistance to be tested, with currently decreased probability that $7.0 might be reached.

boom boom kaboomyyah yah blah blah link gonna go effin nuts yall already know this deep down, largest web 3 market share im early and ill keep dca'ing


#btcstarburst Chainlink Running Bull?The so far the white has marked the target… the red will be the bear… trading above the white supper bullish no worries… Below the white Fud in the market but hopeful… All lines are support and resistance. This is a Gann study always…DCA safely Link has great potential

Link LongThis is an interpretation of the technicals and is in no way shape or form advice.
Any and all liability for risks resulting from investment transactions or other asset dispositions carried out by the customer based on information received or a market analysis is expressly excluded by Tradeciety. All the information made available here is generally provided to serve as an example only, without obligation and without specific recommendations for action. It does not constitute and cannot replace investment advice. We therefore recommend that you contact your personal financial advisor before carrying out specific transactions and investments.

LINK longterm forecastThis is my idea for Chainlink vs USD
As always - no financial advise!
Happy trading

#btcstarburst If Chainlink Breaks ? BTCIf the market moves we could see chainlink move like it has in the past… we could see many Alts take off in 2023… there could be a be changed A macro cup and handle play out… People say how ICP is so bearish well it could be… I have accumulated enough on the lower end to take the risk long term. DCA SAFELY this is a GANN STUDY

LINK: still in reversalAfter not being able to make a clear road toward the $8.0 resistance line two weeks ago, LINK entered into short correction during the previous week, exactly as it was expected. What is interesting with this coin is that while general investors hesitate to enter into any position, LINK acts like it does not have such a problem. This is quite positive, as it supports investors' positive prospectus on the coin.
LINK started the previous week around level of $7.5 and moved to the downside, to the lowest weekly level at $6.7. RSI was pushed from the level of 56 down to 46, indicating that the market is probably still not over with selling orders. Moving averages of 50 and 200 days continue to move as two parallel lines with very tight distance between them, which increases probability of potential cross in the near future.
At this moment, charts are not clearly pointing that the reversal from the previous week is still over. In this sense, the level of $6.5 might be tested, with lower probability that price might reach the $6.0 support line. On the opposite side, $7.0 resistance might be tested again, with still lower potential over $8.0 next resistance line.

Link Global LongMarket gives a good R\R (27) position. As we didn't break 0.618 or 0.786 - my vision is bullish.
All this BTC's downtrend LINK was showing a perfect sideway ( Accumulation )
Downtrend Resistance's got broken so Long here is the best option.
SL -25% gives u an opportunity to use up to 4x leverage.
RSI is above MA in oversold area.

$LINK - TRADING OPPORTUNITY. Short Term, 4H Chart.$LINK - TRADING OPPORTUNITY.
Yesterday we posted a bearish 1D Chart for Chainlink. But in the short term, I'm expecting some upside.
This is the EXACT trade I'm taking. (4H Chart)
The SL shows the Stoploss, and the green supply box is where I'm looking to sell!
#LINK

One more timeOne more dump and the last to buy this Oracle.
The Oracle of the Blockchain for the planet.

LINK Good Landing
The benefit of link has ended
no favorable support
it will start to fall
Follow me and take you to achieve wealth freedom

$LINK - THE DAWN BEFORE THE STORM$LINK - REJECTION. (2D CHART)
After a good move from $6, we rejected at the original break down level.
Will ChainLink finally head to the Gray Support Box?
$3.5 - $5 is were the real buying opportunities of a lifetime are for #LINK.


LINK: on a quest for $8.0During these turbulent times on the crypto markets, LINK came as a surprise, as the coin was holding strongly between levels of $6 and $7. It shows that investors still have high confidence in future prospectus of this coin, regardless of general developments on the market. During the previous week, LINK reached its highest level at $7.8. Resistance line at $8.0 has not been tested on this occasion. Instead, the coin reverted a bit to the downside, as of the end of the week, finishing the week around $7.3 level.
During the week RSI was pushed up to the level of 60, still the indicator is ending the week around level of 54. Regardless of short reversal, it still shows that investors are more interested in the overbought side of the market, than the opposite one. It also adds to potential for the price to be pushed higher in the coming period. Moving averages of 50 and 200 days continue to move as two parallel lines with very tight distance between them, which increases probability of potential, cross in the near future.
Charts are showing that LINK entered into a short reversal, after not being able to make a clear move toward the next resistance line at $8.0. In this sense, the support line at $7.0 might easily be the next target for LINK at the beginning of the week ahead, eventually $6.5. In case that this line is not clearly breached, then it might be expected for LINK to continue its quest toward the $8.0 resistance line for one more time.

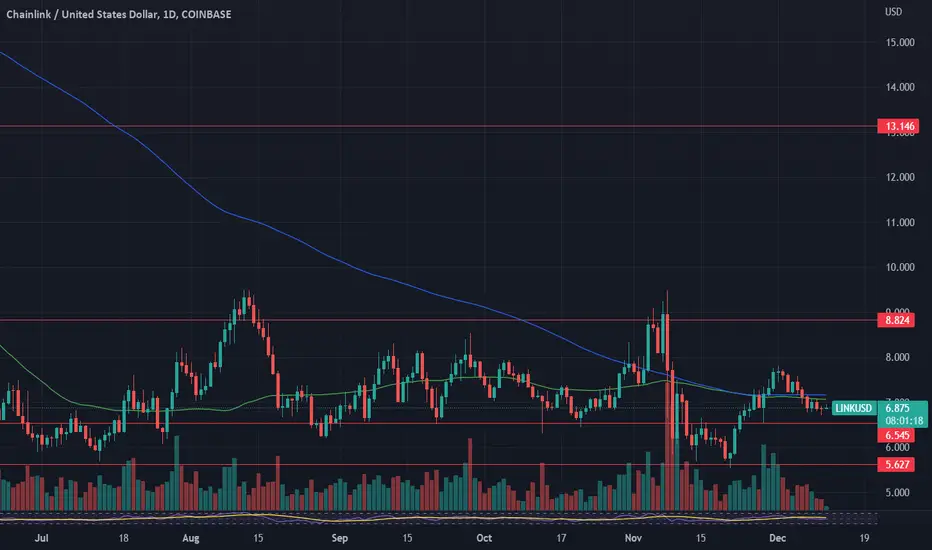
LINK rangeLINK/USD has been ranging for 6 months. The only way to trade LINK for now is to know the numbers. When I crunched the numbers, based on this current ranging pattern, LINK deviation is equal to -or+ $0.555 between these levels. At some point in the future LINK can break out or break down from this range, but it may take a very long time. Regardless of long or short positioning, these key levels are what to wait for. Here's LINK support and resistance levels on the 1-day chart:
R3 = $9.27
R2 = $8.72
R1 = $8.16
pivot = $7.61
S1 = $7.05
S2 = $6.50
S3 = $5.94
Do your own due diligence, your risk is 100% your responsibility. This is for educational and entertainment purposes only. You win some or you learn some. Consider being charitable with some of your profit to help humankind. Good luck and happy trading friends...
*3x lucky 7s of trading*
7pt Trading compass:
Price action, entry/exit
Volume average/direction
Trend, patterns, momentum
Newsworthy current events
Revenue
Earnings
Balance sheet
7 Common mistakes:
+5% portfolio trades, capital risk management
Beware of analyst's motives
Emotions & Opinions
FOMO : bad timing, the market is ruthless, be shrewd
Lack of planning & discipline
Forgetting restraint
Obdurate repetitive errors, no adaptation
7 Important tools:
Trading View app!, Brokerage UI
Accurate indicators & settings
Wide screen monitor/s
Trading log (pencil & graph paper)
Big, organized desk
Reading books, playing chess
Sorted watch-list
Checkout my indicators:
Fibonacci VIP - volume
Fibonacci MA7 - price
pi RSI - trend momentum
TTC - trend channel
AlertiT - notification
tickerTracker - MFI Oscillator
www.tradingview.com

Link spot position (long)Bought based purely on the reset of the 4hr stochastic. Will sell when the stoch hits the sell zone (blue and orange cross above 90%)

Chainlink $LINK is done playing gamesChainlink is about to take SWIFT revenge on everyone who doubted it,
super quadratic staking coming out this month - major utility and use case for the LINK token,
all of DeFi relies on Chainlink to function reliably,
Chainlink swooping in on hiring all the Google and Facebook talent one by one.
someone knows something.
$LINK to 1000$ is not a meme,
100$ first
then 1000$
