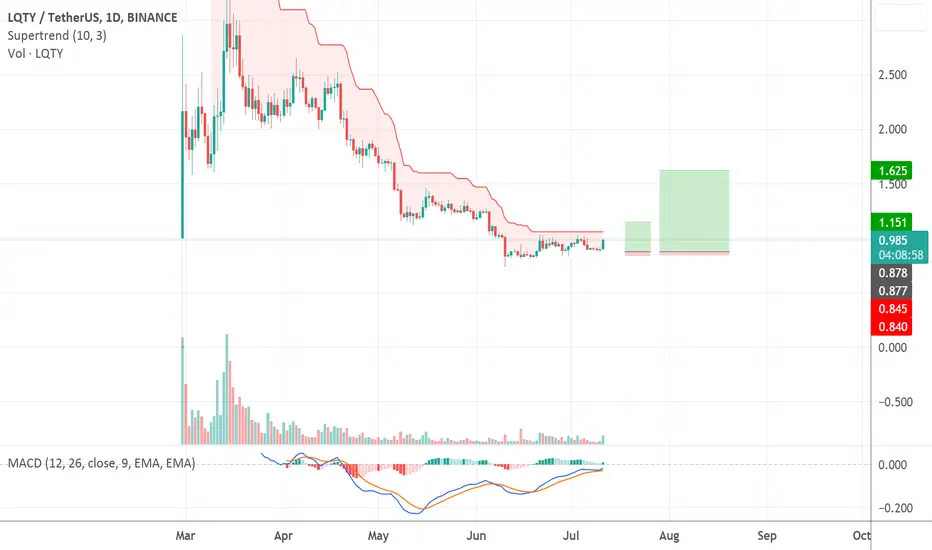
Nearing a Turnaround or Testing Deeper Waters?The LQTY price is below the middle band (Basis at 1.454), which often indicates bearish momentum. However, it's approaching the lower band (1.331), suggesting that the asset might be entering oversold territory. If it reaches the lower band, it might experience buying pressure.
The MACD line is below the Signal line, and the histogram is in the negative territory, signaling a bearish trend. This suggests that sellers are currently in control.
The RSI is at 34.87, which is nearing the oversold threshold (30). This could be an early indication that the selling pressure might be exhausting, and a reversal could be on the horizon.
Fibonacci Retracement Levels:
The price is currently near the 0.5 retracement level (1.257). This level often acts as a significant psychological barrier:
If the price maintains above this level, it can act as a support, indicating strength in the asset's price.
If it breaks below, the next significant support is at the 0.618 level (1.186), which might be where buyers step in.
Conclusion and Most Probable Scenario:
The current technical indicators suggest a bearish short-term momentum for LQTY. The asset seems to be in a correction phase, approaching significant support levels. The nearing oversold RSI and its proximity to the 0.5 Fibonacci retracement level might indicate a potential for a bullish reversal soon. However, if the asset fails to hold above the 1.257 level, a further decline to the 1.186 level (0.618 Fibonacci level) could be anticipated.
Overall Trend: Currently bearish, but with signs hinting at a potential reversal.
LQTYUSDT trade ideas


LQTY weekly pinbarLQTY chart on weekly TF really look weak at the moment because we did double bottom on weekly TF and this current weekly candle look like it want to create bearish pinbar which means a fakeout from the neckline of the double bottom…. And any close above the neckline on weekly TF will triggered the price to at least $1.6 to $2 on daily TF resistance…. Watch closely how the weekly candle close…..
Follow for more market update

LQTY pump is over, now DUMPI think Lqty pump over and it is giving sell signal on daily. If you want to wait you can wait 1.13 but don't want it you can enter here this is a reference for you:
Entry: 1.3621
TP1:1.3493
TP2:1.3356
TP3:1.322

LQTY has strong resistance level and bullish triangle A strong resistance of $1.5 formed on the coin, which was stabbed and fixed below. Also, increased volumes came out in the resistance zone, which means that the instrument is in the distribution phase. Trading volumes have fallen. At the moment, the instrument is being pressed to the local support line behind which the stops of market participants are located. It is possible to roll back to the resistance line again and with further trading.
We expect a breakdown of the local support level with the next approach. Open positions with high activity before the breakdown and at the time of the breakdown of the $1.45 level
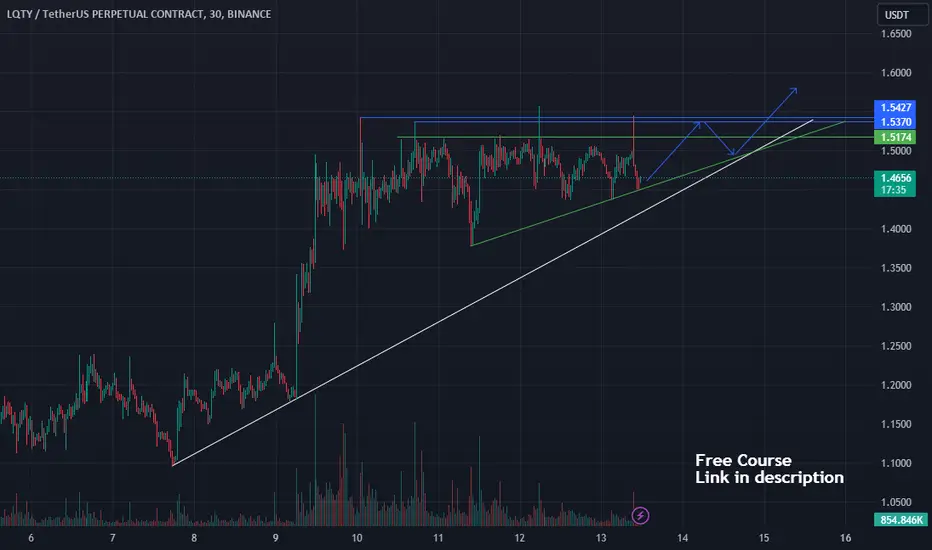
LQTY Has bullish Rally Base Rally patternThe instrument in the game, increased volumes, activity in the glass, after the upward movement is in the phase of reaccumulation, as a result of which it formed a cascade of resistance levels, the closest on a round number and near VAH, also presumably a bullish Rally Base Rally pattern is formed, ideally I want to see another touch in the level and local trading, with a smooth approach, preload and increase of activity in the glass, I expect an impulse exit to long with the withdrawal of liquidity beyond the levels.

LQTYUSDT.P Bearish wick filling price BINANCE:LQTYUSDT.P Now we are on the way to open Short Trade, we have wick price around
$ 2$ price must be fill this price after that we go on our bearish target until 1,30$ & 1,15$
1,92 and 2$ our strong Resistence zone also, Our Technical analysis is weekly Timeframe so that we need to wait more in order to reach our main Target
BINANCE:LQTYUSDT.P MEXC:LQTYUSDT.P BYBIT:LQTYUSDT.P BITGET:LQTYUSDT.P

LQTYUSDT(Liquity) Daily tf Range Updated till 09-10-23LQTYUSDT(Liquity) Daily timeframe range. its a high volatile pair to make money you got to have a right plan trying to break 1.444 , its a strong resistance, if it breaks clear path to 1.745 if volume stays.


LQTYUSDT Liquity LONG TRADE 2023 Oct 07Signal: Green * n
Structure Break out
Assumption: BTCUSDT holds 27100
Risk-Reward: 3
DISCLAIMER
This is only a personal opinion and does NOT serve as investing NOR trading advice.
Please make your own decisions and be responsible for your own investing and trading Activities

Keeping an eye on #LQTY/USDT in 4-Hour TF!Keeping an eye on #LQTY/USDT in 4-Hour TF!
CRYPTOCAP:LQTY is testing the major resistance zone. Wair for Breakout and retest to open a Long position.
In case of rejection, we can short it.

"Riding the LQTY Wave: A Strong Buy Signal EmergesThe LQTY coin is the native cryptocurrency of the Liquity protocol, a decentralized lending and borrowing platform. Liquity is unique in that it offers users the ability to borrow against their Ethereum collateral without having to pay any interest. Instead, borrowers are required to maintain a minimum collateral ratio of 110% at all times. If the collateral ratio falls below 110%, the borrower's position will be liquidated and their collateral will be sold to repay the loan.
**Fundamental Analysis**
The Liquity protocol has a number of advantages over other lending and borrowing platforms. First, it is decentralized, which means that it is not controlled by any single entity. Second, it is transparent, as all transactions are recorded on the Ethereum blockchain. Third, it is efficient, as it uses a number of innovative features to reduce the costs of borrowing and lending.
The Liquity protocol is also highly scalable and can handle a large number of transactions. This is important because it means that the platform can be used by a wide range of users, from small investors to large institutions.
**Recent News**
On September 26, 2023, the Liquity protocol launched its mainnet. This means that the protocol is now fully operational and users can start borrowing and lending LQTY coins.
On September 22, 2023, the Liquity protocol announced that it had been selected by the World Economic Forum to participate in its Blockchain for Social Impact initiative. This initiative aims to use blockchain technology to solve some of the world's most pressing social problems.
**Disclaimer**
Cryptocurrencies are volatile assets and prices can fluctuate wildly. It is important to do your own research before investing in any cryptocurrency.
Please note that this is not financial advice.

LQTYUSDTBINANCE:LQTYUSDT Short idea
⛔"Daily crypto market analyses I provide are personal opinions & not financial advice. Trading carries risks, so do your own research & seek advisor's help.#DYOR"
Don't forget to like and comment

LQTYUSDTLQTYUSDT is in bullish trend. Potentially printing HH and HL.
Bullish Flag pattern form which will indicates trend will continue from here.
we wait and watch for the breakout of flag pole.

2RR trade idea on LQTY/USDT pairA scalp trade.
After careful top-down analysis, from weekly to hourly time frames, here's a possible trade idea.
From last two candles, long and short liquidity were swept almost evenly. The trade idea suggests a possible 2RR short.

Liquity (LQTY) formed bullish Gartley for upto 12% pumpHi dear friends, hope you are well and welcome to the new trade setup of Liquity (LQTY) with US Dollar pair.
Recently we caught almost 20% pump of LQTY as below:
Now on a 4-hr time frame, LQTY has formed a bullish Gartley move for the next pump.
Note: Above idea is for educational purpose only. It is advised to diversify and strictly follow the stop loss, and don't get stuck with trade.

Liquity (LQTY) formed bullish Gartley for another price reversalHi dear friends, hope you are well and welcome to the new trade setup of Liquity (LQTY) with US Dollar pair.
Previously we caught more than 100% pump of LQTY as below:
Now on a 4-hr time frame, LQTY has formed a bullish Gartley move for the next pump.
Note: Above idea is for educational purpose only. It is advised to diversify and strictly follow the stop loss, and don't get stuck with trade.

LQTY is making a major bullish moveHello Traders🖐🏿
In this situation if LQTY buyers can push the price above 1.2 and break this strong resistance zone, we can see a upward move around 2$.
Every technical analysis showing that bulls are stronger than bears at this time.
Eyes on chart👌🏿
Its not a financial advice, its just my idea.


LQTYUSDTLQTYUSDT is in bearish phase.
No divergence shown in RSI which indicates trend is going to continue here.
we wait and watch for the breakout of last LL.
