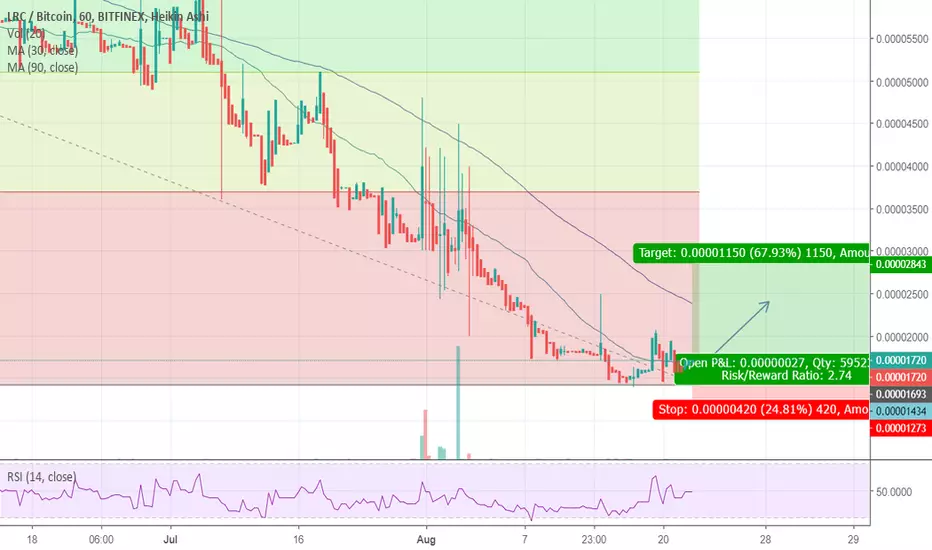
$LRC Good increase in volume
nice rounded bottom
clear accumulation
when this runs it will run hard
should see hold around the blue zone and consolidate for next leg up
disclaimer: I am not in this trade. currently only playing bitmex
LRCBTC trade ideas

LRC 850% Profits Opportunity: Even a 4 yr old kid can tell this!Buy Zone : 1250 sats - 1650 sats
Mid to Long Term Targets
Target 1 : 3763 sats
Target 2 : 5300 sats
Target 3 : 6842 sats
Target 4 : 7784 sats
Target 5 : 9552 sats
Stop Loss : 1100 sats
#TogetherWeAccumulate

There is a possibility for the beginning of an uptrend in LRCBTCTechnical analysis:
. LOOPRING/BITCOIN is in a range bound and the beginning of uptrend is expected.
. The price is above the 21-Day WEMA which acts as a dynamic support.
. The RSI is at 57.
. While the price downtrend in the Daily chart is not broken, bearish wave in price would continue .
Trading suggestion:
. There is a possibility of temporary retracement to suggested support zone (0.00001540 to 0.00001270). if so, traders can set orders based on Price Action and expect to reach short-term targets.
Beginning of entry zone (0.00001540)
Ending of entry zone (0.00001270)
Entry signal:
Signal to enter the market occurs when the price comes to "Buy zone" then forms one of the reversal patterns, whether "Bullish Engulfing" , "Hammer" or "Valley" in other words,
NO entry signal when the price comes to the zone BUT after any of the reversal patterns is formed in the zone.
To learn more about "Entry signal" and the special version of our "Price Action" strategy FOLLOW our lessons:
Take Profits:
TP1= @ 0.00002310
TP2= @ 0.00002760
TP3= @ 0.00003640
TP4= @ 0.00004360
TP5= @ 0.00005110
TP6= @ 0.00006290
TP7= @ 0.00007480
TP8= @ 0.00009160
TP9= @ 0.00011320
TP10= @ 0.00015400
TP11= Free

LRC/BTC potential reversalPotential rounding bottom and ascending triangle is forming. EMA 200 on 4H serves as the horizontal resistance of the triangle. Possible reversal of trend if the triangle pattern completes breakout.

LRC Trading AdviceBuy Price: Yellow Line
TP: Green Lines
Invest Suggestion: 5-10 Percent
Profit Expectations: 5, 10 or >20 Percent
Just hold and watch. All targets will be reached within 24 to 72 hours as my prediction. But it's recommended to hold it for 6-7 days if any target not reached. Sell when you got some profit. I am sure, you will be get nice profit. Good Luck!
Thanks for visiting.

[LRC/BTC] VERY GOOD RISK/REWARD ON LOOPRING [ 400% POTENTIAL ]#LRC / BTC 0.40% ( Binance )
Buy Range : 1500
Stop Loss : Below 1266 ( Optional )
Short-term - > 2185
Target 1 : 3495
Target 2 : 5350
Target 3 : 6700
STOCH RSI CHART :
If we look into STOCH RSI Chart, we can see how has backed to support after recent movement on April. Now , its trying to go up suggesting some movements on the price.
ON BALANCE VOLUME :
Weekly chart reveals reversal movement which started on early September, this price action could be suggesting back and touch the trendline as did on April
MACD/T3-CCI/RSI :
They still inside of negative territory but are sharing better perfomance on the last weeks and it could be positive soon
VOLUME :
Still weak but having its having positive action on the last two weeks
TD SEQUENTIAL:
We have a 9 on the weekly chart which could boost the prices according to momentum. If we look a green two after this green one we could be talking of bullish reversal. Anyway, this price is very good to buy and wait for our targets


Following price action on Loopring's chart...Targets +10-40%... Remember to follow the market.
Hello everyone, remember always this.... " its harder to keep the $ than earning them".. During this bear market ive been taking a lower amount trades; yet, I have been following the market very closely... Loopring's support has been holding well during a few days.... previous support only held for 13 days each during this bear market.. but this time it held twice the days (around 23-28 days) as the previous one.

Daily Bullish Signal for #LRC #LRCBTC (11-09)#LRC (LRC/BTC)
Buy : 1450
Flash Sell : 1475-1500-1525-1550
Short Sell : 1600-1650-1700-1750
Long Sell : 1800-1900-2000-2100
Stop : 1300
Follow me for more signals daily
PM me if you need to learn TA


Technical Analytic for #LRC #Loopring (29/08) - CryptoStation#LRC (LRC/BTC)
Buy : 1900
Flash Sell : 1925-1950-1975-2000
Short Sell : 2050-2100-2150-2200-2250
Stop : 1750
Follow me for more signals
Inbox me for more and more signals

LRC Long Technicals + Event-DrivenAll time lows on LRC pending reversal and Airdrop upcoming next week.
LRC/BTC possibly longIf LRC can finally leav the downtrend channel, the next stop will be at 3.3k satoshi.
Do you like my TA?
Give me a thumbs up please.
Good luck everybody, this can be your 100% profit coin in the next couple of weeks.


Loopring Trade Ideas with Potential Buy OpportunityFalling wedge breakout and price approaching for possible re-test, and RSI is oversold.
Entry and exit targets are clearly stated on the chart.
BLUE: POSSIBLE ENTRY ZONE
RED: STOP LOSS LEVEL
GREEN: SELL TARGETS
Join our discussion room for more about our trading signals.
Please do click on like icon.
Thanks.

LRCBTC: Looking for a High Rewards BounceLRCBTC is approaching a critical level on the daily time frame. Either it will bounce off this price point or continue to drop further. We see an opportunity for a low-risk/high-reward trade with a tight stop-loss.
Targets are:
Buy: 0.00003150 - 0.00003250
Target 1: 0.00003967
Target 2: 0.00004607
Target 3: 0.00005403
Target 4: 0.00007057
Stoploss: Close below 0.00003028

LRCBTC long term growth is expectedDirectional movement indicator shows low price fluctuations and a gradual rise according to MACD, Stoch RSI and Ichimoku clouds. Moreover at the long term timeframes the price is going to form bullish Gartley butterfly pattern. If this happens the price will break out from descending triangle and will consolidate for the further long term growth.

Long $1k to $100k Challenge - Day 4 Trade #5 - LRCHello all and thanks for stopping by and following my personal challenge. I am attempting to turn $1000 into $100,000 by the end of the year by day trading altcoins.
I started my challenge on July 14th with a bankroll of 0.16 Bitcoin that was valued at $1000 at the time. You can follow and see all my trades in my profile.
Trades this far:
Day 1 BTS: +5% profit
Day 2 VIA: +5% profit
Day 2 ADA: Adjusted my stop and it was hit. Dead trade slight profit less than 1%
Day 3: EDO: pending
I will show a complete trade breakdown on the next post.
Alright, here we go with Day 4 trade #5
I invested 0.0855047 B in LRC bought 1871 @ 4570 satoshi
Sell target is: 4799 for 5% profit
Stop loss: 4342
Your comments, agrees and disagrees are always welcome and appreciated.
Thanks for stopping by and have a great day!


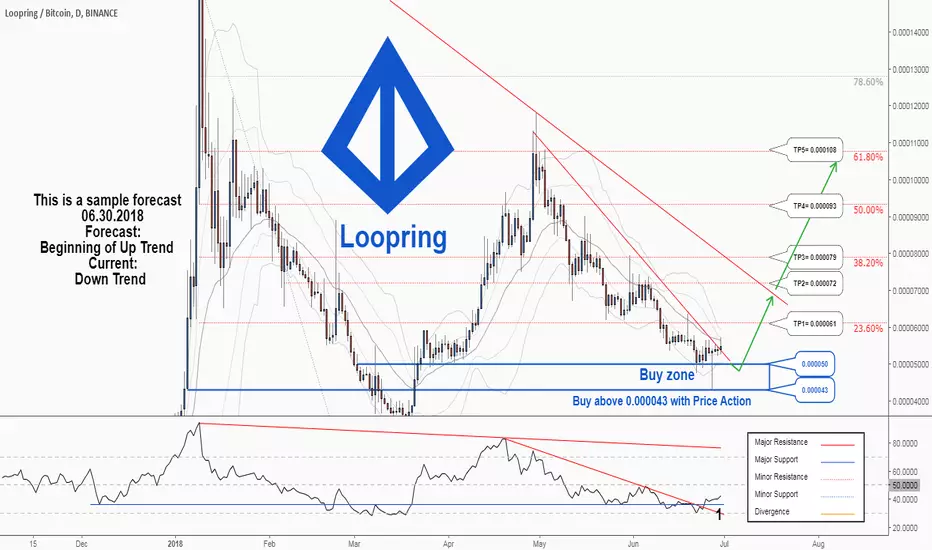
There is a possibility for the beginning of uptrend in LRCBTC Technical analysis:
. LOOPRING/BITCOIN is in a downtrend and beginning of uptrend is expected.
. The price is below the 21-Day WEMA which acts as a dynamic resistance.
. The RSI is at 40.
. The RSI downtrend #1 is broken, so the probability of beginning of uptrend is increased.
Trading suggestion:
. The price is in a downtrend and we forecast the uptrend would begin.
. There is a possibility of temporary retracement to suggested support zone (0.000050 to 0.000043). if so, traders can set orders based on Price Action and expect to reach short-term targets.
Beginning of entry zone (0.000050)
Ending of entry zone (0.000043)
Entry signal:
Signal to enter the market occurs when the price comes to "Buy zone" then forms one of the reversal patterns, whether "Bullish Engulfing" , "Hammer" or "Valley" in other words,
NO entry signal when the price comes to the zone BUT after any of reversal patterns is formed in the zone.
To learn more about "Entry signal" and the special version of our "Price Action" strategy FOLLOW our lessons:
Take Profits:
TP1= @ 0.000061
TP2= @ 0.000072
TP3= @ 0.000079
TP4= @ 0.000093
TP5= @ 0.000108
TP6= @ 0.000154
TP7= Free

There is a possibility for the beginning of uptrend in LRCBTCTechnical analysis:
. LOOPRING/BITCOIN is in a downtrend and beginning of uptrend is expected.
. The price is below the 21-Day WEMA which acts as a dynamic resistance.
. The RSI is at 40.
. The RSI downtrend #1 is broken, so the probability of beginning of uptrend is increased.
Trading suggestion:
. The price is in a downtrend and we forecast the uptrend would begin.
. There is a possibility of temporary retracement to suggested support zone (0.000050 to 0.000043). if so, traders can set orders based on Price Action and expect to reach short-term targets.
Beginning of entry zone (0.000050)
Ending of entry zone (0.000043)
Entry signal:
Signal to enter the market occurs when the price comes to "Buy zone" then forms one of the reversal patterns, whether "Bullish Engulfing" , "Hammer" or "Valley" in other words,
NO entry signal when the price comes to the zone BUT after any of reversal patterns is formed in the zone.
To learn more about "Entry signal" and the special version of our "Price Action" strategy FOLLOW our lessons:
Take Profits:
TP1= @ 0.000061
TP2= @ 0.000072
TP3= @ 0.000079
TP4= @ 0.000093
TP5= @ 0.000108
TP6= @ 0.000154
TP7= Free