#LRC Ready for a Massive Recovery From Here | Must Watch Yello, Paradisers! Is #LRCUSDT finally ready for a breakout, or is it just another trap for early bulls? Let's break down the current structure of #LRC.
💎#Loopring ( CAPITALCOM:LRC ) has been moving within a descending wedge pattern for weeks, with price consistently making lower highs and lower lo
Related pairs
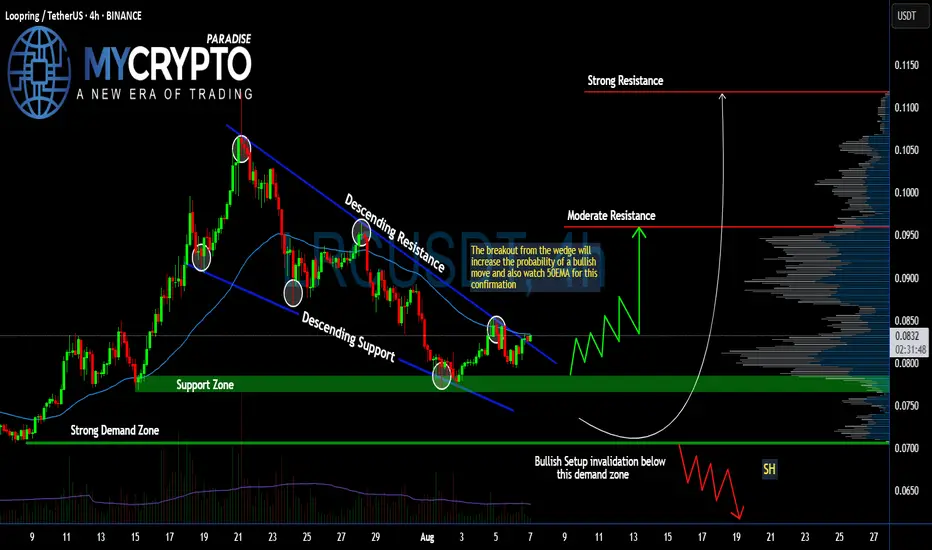
LRC – Breakout Watch in Motion📆 On the 2H timeframe, CAPITALCOM:LRC is attempting a breakout from the falling wedge structure — a bullish pattern gaining momentum ⚠️
A clean breakout and hold above resistance could open doors to a swift upside move 📈
👀 Keep this setup on your radar — structure is heating up!
Not financial a
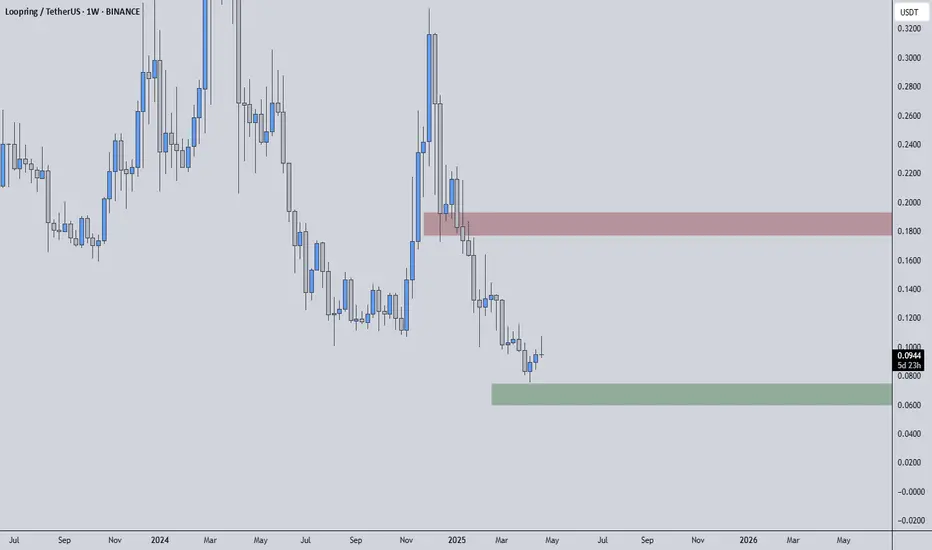
LRC/USDT 1W – Final Test Before a Major Reversal?> Loopring (LRC) is currently sitting at a critical long-term support zone, and the next few weeks could determine whether a strong reversal or deeper decline will follow.
---
🧠 Macro Overview:
After falling more than 97% from its all-time high (ATH) of $3.0596, LRC is now revisiting a historical

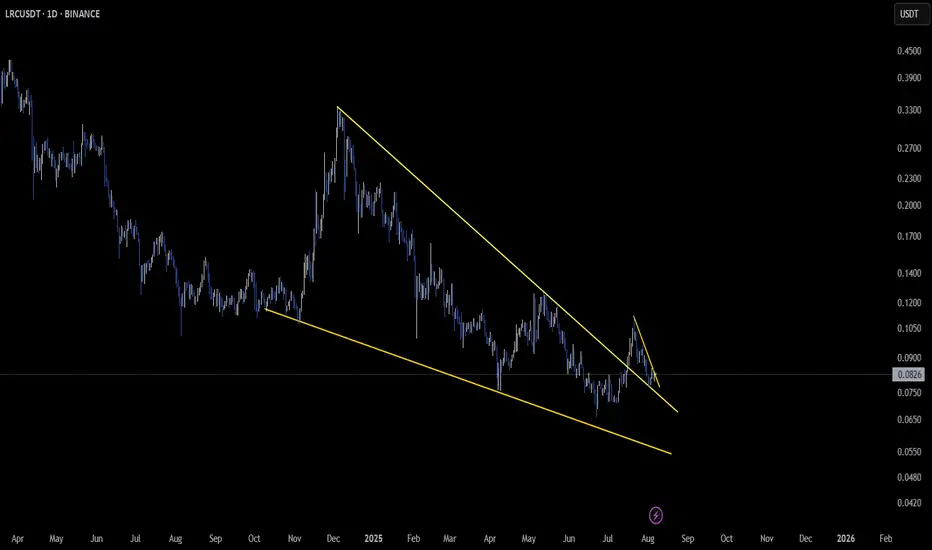
LRCUSDT 1D#LRC has broken above the falling wedge resistance and is now facing the daily SMA100.
For the bullish move to continue, it needs to break above the SMA100 as well.
The best entry point would be on a successful retest of the pattern.
Targets:
🎯 $0.1010
🎯 $0.1228
🎯 $0.1405
🎯 $0.1581
🎯 $0.1832
⚠️ A

LRC analysisPrice is currently trading within a tight range and is approaching the resistance area. We'll see if the price can break above this resistance area. New positions will be opened after a breakout and retest.
Resistance Area: $0.0920-$0.0956

LRC - Sine Line Says: Bullish!Hello TradingView Family / Fellow Traders! This is Richard, also known as theSignalyst.
The picture says it all!
📈For the bulls to take over and ignite the next bullish wave in line with the Sine Line cycles, a break above the $0.12 structure marked in blue is needed.
📚 Reminder:
Always stick

LRC long loopringIm just seeing opportunities to go long on good value tokens.
None of this is financial advice, im just pointing out that if you are patient and know what you are looking for then the right times to trade are easy to spot.
my long strat has triggered

LRCUSDT | Weak Support, Strong Resistance — Proceed with CautionLRCUSDT is trading between clearly defined zones, where the red box acts as a significant resistance and the green box serves as a mild support level. However, the critical detail here is that the support does not appear very reliable — and that should make you extra cautious if you're planning to l
LRCUSDT 1WLRC ~ 1W Analysis
#LRC This is the lowest support at this time, maybe you can consider starting to buy back from here with a short -term target of at least 15%+

LRC: BULLISH divergence on daily chartBullish Divergence Confirmed:
Both the RSI (Relative Strength Index) and MACD (Moving Average Convergence Divergence) are showing bullish divergence on the daily chart. While the price has made a lower low, the RSI and MACD have formed higher lows, indicating weakening downward momentum and a potent

See all ideas
Summarizing what the indicators are suggesting.
Oscillators
Neutral
SellBuy
Strong sellStrong buy
Strong sellSellNeutralBuyStrong buy
Oscillators
Neutral
SellBuy
Strong sellStrong buy
Strong sellSellNeutralBuyStrong buy
Summary
Neutral
SellBuy
Strong sellStrong buy
Strong sellSellNeutralBuyStrong buy
Summary
Neutral
SellBuy
Strong sellStrong buy
Strong sellSellNeutralBuyStrong buy
Summary
Neutral
SellBuy
Strong sellStrong buy
Strong sellSellNeutralBuyStrong buy
Moving Averages
Neutral
SellBuy
Strong sellStrong buy
Strong sellSellNeutralBuyStrong buy
Moving Averages
Neutral
SellBuy
Strong sellStrong buy
Strong sellSellNeutralBuyStrong buy
Displays a symbol's price movements over previous years to identify recurring trends.
Frequently Asked Questions
The current price of LRCUSDT SPOT (LRC) is 0.0904 USDT — it has risen 3.55% in the past 24 hours. Try placing this info into the context by checking out what coins are also gaining and losing at the moment and seeing LRC price chart.
LRCUSDT SPOT price has risen by 13.57% over the last week, its month performance shows a 20.05% increase, and as for the last year, LRCUSDT SPOT has decreased by −31.95%. See more dynamics on LRC price chart.
Keep track of coins' changes with our Crypto Coins Heatmap.
Keep track of coins' changes with our Crypto Coins Heatmap.
LRCUSDT SPOT (LRC) reached its highest price on Mar 29, 2022 — it amounted to 1.3585 USDT. Find more insights on the LRC price chart.
See the list of crypto gainers and choose what best fits your strategy.
See the list of crypto gainers and choose what best fits your strategy.
LRCUSDT SPOT (LRC) reached the lowest price of 0.0659 USDT on Jun 22, 2025. View more LRCUSDT SPOT dynamics on the price chart.
See the list of crypto losers to find unexpected opportunities.
See the list of crypto losers to find unexpected opportunities.
The safest choice when buying LRC is to go to a well-known crypto exchange. Some of the popular names are Binance, Coinbase, Kraken. But you'll have to find a reliable broker and create an account first. You can trade LRC right from TradingView charts — just choose a broker and connect to your account.
Crypto markets are famous for their volatility, so one should study all the available stats before adding crypto assets to their portfolio. Very often it's technical analysis that comes in handy. We prepared technical ratings for LRCUSDT SPOT (LRC): today its technical analysis shows the buy signal, and according to the 1 week rating LRC shows the sell signal. And you'd better dig deeper and study 1 month rating too — it's sell. Find inspiration in LRCUSDT SPOT trading ideas and keep track of what's moving crypto markets with our crypto news feed.
LRCUSDT SPOT (LRC) is just as reliable as any other crypto asset — this corner of the world market is highly volatile. Today, for instance, LRCUSDT SPOT is estimated as 3.67% volatile. The only thing it means is that you must prepare and examine all available information before making a decision. And if you're not sure about LRCUSDT SPOT, you can find more inspiration in our curated watchlists.
You can discuss LRCUSDT SPOT (LRC) with other users in our public chats, Minds or in the comments to Ideas.