LRC targetsthe first resistance is 30% up it really isnt heavy could be an easy breakthrough 60% is the next one may levels thagt is a major area...
We have seen lrc go on crazy runs before "fall/winter"2021
LRCUSDT trade ideas

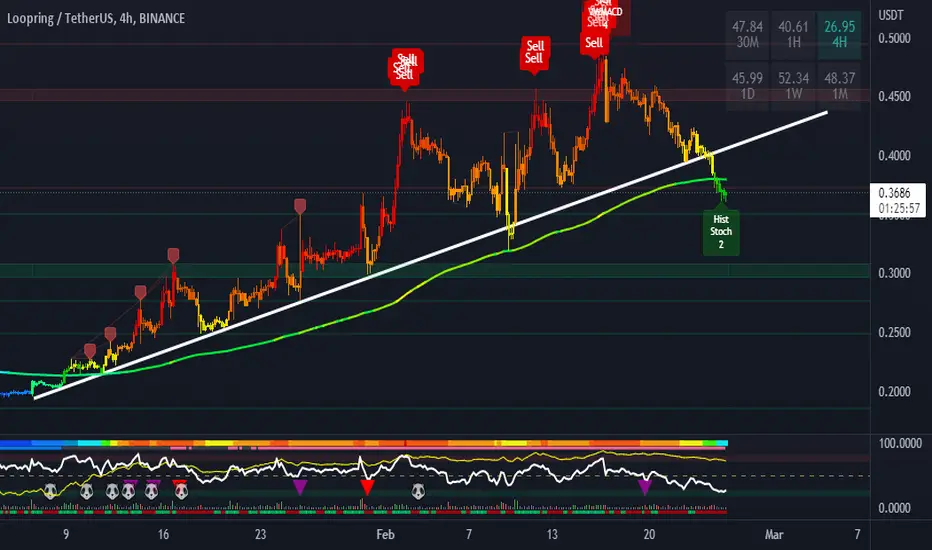
LRCIdea: The price has broken through the uptrend line and the 200 EMA of the 4 hour time frame - the key support levels. The nearest support levels are $0.35 and $0.3. The price may retest 200 EMA, then the fall will continue
Loopring token (LRC) forming bullish Cypher for upto 46% pumpHi dear friends, hope you are well and welcome to the new trade setup of Loopring token ( LRC ) with US Dollar pair.
On a daily time frame, LRC is about to complete the final leg of a bullish Cypher move.
Note: Above idea is for educational purpose only. It is advised to diversify and strictly follow the stop loss, and don't get stuck with trade

LONG POSITION It has reached its own support area and has returned, and for the next day, it is likely to grow to block order areas The first target is 0.4580 and the second target is 0.4960

LRCUSDTHello Crypto Lovers,
Mars Signals team wishes you high profits.
This is a 4-hour-time frame analysis for LRCUSDT
In the current chart, R3 used to a support area. R1 is the resistance area which contains the unsuccessful attempts of price to rise. S1 used to be a resistance line. And S2 is our support line at the bottom with its well support of price at several points. Presently, the price was able to have a noticeable rise and touch S1 and then by having a falling trend, it could break S1 upward and now it is fluctuating over it. We will predict the price to give us some rising signs and an increase is waiting for it to touch R1 besides the activation of the long position of our chart. Or even by not being supported, more fall would take place for the price downward to lower amounts. We recommend you to have every piece of information and idea via our analyses for receiving more profitable trades.
Warning: This is just a suggestion and we do not guarantee profits. We advise you to analyze the chart before opening any positions.
Wish you luck

lrcusdtWe have a support at the specified level. We have to see how the reaction to this level will be
LRC: Approaching ResistanceLoopring (LRC) technical analysis:
Trade setup : Bullish breakout from Falling Wedge pattern, was confirmed with a break above $0.30 key level to indicate bullish trend reversal. Price broke above $0.40 resistance to resume uptrend and reached our target $0.50. Now we wait for price to either 1) break above $0.50 to resume uptrend, or 2) pull back near $0.40 support for a swing entry in uptrend.
Trend : Uptrend across all time horizons (Short- Medium- and Long-Term).
Momentum is Bullish (MACD Line is above MACD Signal Line and RSI is above 55).
Support and Resistance : Nearest Support Zone is $0.40 (previous resistance), then $0.30. The nearest Resistance Zone is $0.50.

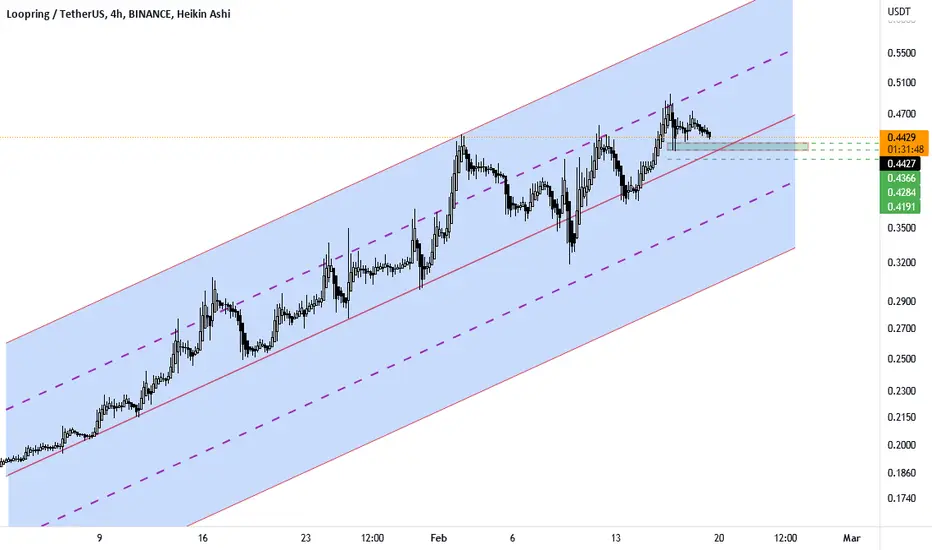
Let's see the LRC/ SHORTWhat do you think about LRC? The market looks bad, and the price is also reacting well to the resistance line around $0.46. We can expect a price decrease to the area ~ $ 0.33
All positions on the chart.
This is not a financial recommendation.
BUY ~ 0.44$
1TP ~ 0.378
2TP ~ 0.3325
SL - 0.479

LRCUSDT is testing the resistance inside the BullflagThe LRCUSDT pair recently experienced an impressive bounce from the daily demand zone at the 0.2$ level.
The price is now creating a bull flag, which is a technical chart pattern that is typically seen as a bullish signal in the market.
A bull flag is characterized by a period of consolidation or a slight pullback after a strong uptrend, forming a flag-like shape on the price chart.
Traders and investors who follow technical analysis may look for a potential breakout above the daily resistance at the 0.42$ area, which could signal a continuation of the uptrend and potentially offer new buying opportunities.
According to Plancton's rules, a successful breakout from the bull flag could be a suitable time to consider opening a new long position in the LRCUSDT market.
–––––
Follow the Shrimp 🦐
Keep in mind.
🟣 Purple structure -> Monthly structure.
🔴 Red structure -> Weekly structure.
🔵 Blue structure -> Daily structure.
🟡 Yellow structure -> 4h structure.
⚫️ Black structure -> <= 1h structure.
Follow the Shrimp 🦐

Keep Your Eyes on LRC (Short with tight stop or Long at BO)Attention traders! It's time to buckle up, because LRC is facing some serious rejection at a major resistance level on the 4-hour timeframe. But don't be intimidated by this wall of resistance, because we're not backing down. We're going to wait for the breakout before opening any long positions, or you can even consider shorting with a tight stop loss above this resistance. Remember, guys, risk management is key to success in the markets, so keep your cool and stay focused. Get ready for some wild times ahead with LRC!

LRC is on fire if.. These are the string areas which LRC has to keep above each one and honeslty LTC looks very sold and bullish already.
So it is a matter of time only insha Allah!
Wait for the weekly close because it ihas to close above the yellow area, if it doesn't then wait for it to renounce from the bottom of the yellow area then enter.
SL will be breaking the Yellow area for 1d.
Good luck!

shortConsidering the current market conditions, as well as the one-hour time supply base and existing compression, it has an attractive trading position in line with sales.

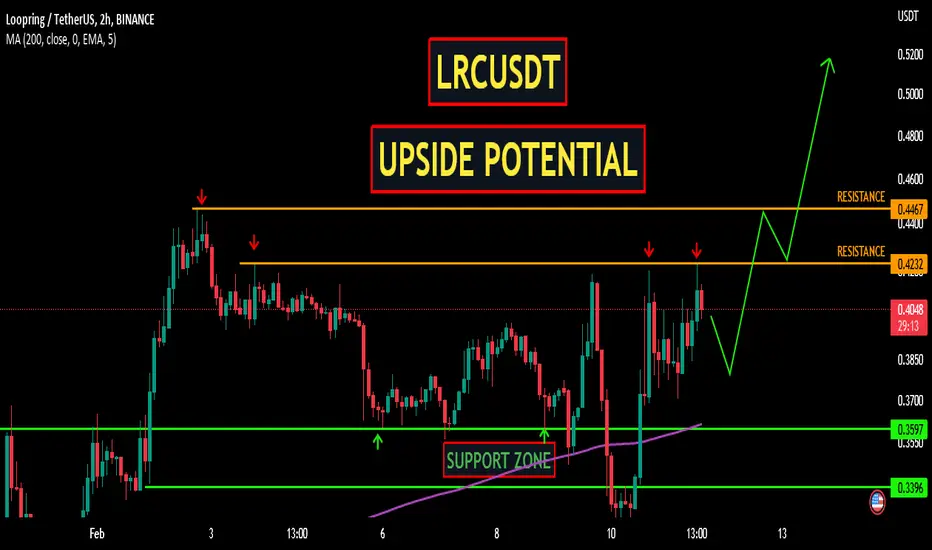
LRCUSDT | UPSIDE POTENTIAL
LRCUSDT has been trading near critical levels.
The price has given fake out under the support zone and bounced back.
Now the price is trading near the horizontal resistance zone . If price flips above the resistance, we have a great upside penitential.
Manage your trades accordingly.
🔥 LRC Bull Flag Break Out During Market WeaknessLRC has been on quite the run in 2023. After a weak February start, LRC has broken out of a bull-flag pattern whilst the market is selling off. In my view, this is a great sign.
Not only for LRC, but the fact that there's still some tokens getting investors' attention during the first real correction of this bullish phase is great news.
Targets in blue.

$LRCflip blue line and send to magnet
lots of room to run once it does flip it and the fomo should kick in
figured might as well get another bag of some thing assuming corn rips up waiting for daily close to see if i can get it lower
.3731ish

LRC Long AnalysisLRC has formed CUP and Handle Pattern, right now waiting for a breakout above the handle trendline, will be taking long on breakout above the trend line

LRCUSDT support range and resistance UpdateAll targets specified for the symbol ( LRCUSDT ) were touched .

LRCUSDT support range and resistanceThe support range and resistance of the symbol is specified in the image.

LRC short term trade scenario 5th of February 2023Hi guys,
I'm grinding on LRC slowly. Next fib 2.0 extension marked on chart as second exit.
Always use stop loss !
Happy hunting !

LRCIdea: prices are trying to break through a strong key resistance - the POC level. The price is in the zone of strong overbought. Support and resistance levels are indicated. Prices will rise to $0.6 if POC breaks

Lrc Looking Good Forming Falling Wedge In Daily Timeframe Incase Of Breakout Expecting 100 To 110% Bulish Wave
Entry Would Be Only Valid After Breakout Safe Area For Sl Would Be Below Wedge


