LRCIdea: The price is trying to break through an important resistance level - the daily 200 EMA. A lot of bearish divergences have formed, the price is in the overbought zone on the daily chart. A bounce down may again lower the price to the $0.2 area. Breakout of 200 EMA will lift the price to the POC level
LRCUSDT trade ideas

Eyes on LRCHolding strong on the retest while the rest of the market dumps. Possibly a big move coming up.

LRCUSDT - 1DLoopring has started to reliably pump on the daily time frame after the wedge break and will follow the above targets after the resistance break.

Loopring LRC/USDTesting/Tracking Elliot waves. Please do not trade off idea without stop loss.
This one is for all the GME fans. I know that some of yall aren't invested in crypto, but because this coin is related to GME, you might invest.
If you're already invested in LRC or will be looking to buy some then the data here should be valuable for you.
On this chart it shows us that we've already gone through a -95% drop. This is normal in the crypto world. Most altcoins will go through a period where they drop -90-98%.
With that being said -95% is already high up there so there's a possibility we may go a bit lower down, but that's a very small amount compared to the possible upside.
If you hoover over to the today's price R/R you can see that from here you have a R/R ratio of 31.6 with the stop loss being underneath the Z wave drop. The Z wave drop is around a -97% drop from ATH.
R/R ratio from today's price: 31.6
Possible upside: 1915%
Possible downside: -60%
R/R ratio from Z wave: 656
Possible upside: 4975%
Possible downside: none. Personally I will not use a stop loss at all on either one.
I would dollar cost average into both and if there's a slightest possibility for another drop from Z wave then I would buy more too.
Do not go all in, especially if you're using leverage, a -60% drop is still big. Better to play it safe than sorry. If you go all in and you can't buy more when Z wave hits, you're out of luck.
From the Z wave I would consider adding a lot more (if we ever get it). This is not financial advice.
Chart timeframe is on the weekly. Expected timeline for this to play out is roughly within 2 years for the wave 3 top.

✴️ Loopring | Many Reversal SignalsThere are many signals supporting a reversal/change of trend on the Loopring chart. LRCUSDT.
Let's spend a few minutes of our time looking at some of those.
#1 - LRCUSDT has gone to new lows and then dove a bit lower, this is good for bottom fishers.
#2 - A very strong shakeout can be seen on the chart. Shakeouts can be indicative of upcoming change.
#3 - The August downtrend has been broken.
#4 - The Cup pattern we see very often, always at support and many times signals a low being set.
#5 - The increase in trading volume happened in November, recently buy volume is predominant on this chart.
#6 - The RSI is super strong at low levels, signaling that the trend can change soon.
#7 - Loopring is trading above EMA50 and EMA100, not possible to be bearish above these levels.
A change of trend is a major development.
A change of trend can lead to years of growth.
In the worst case scenario, these signals can lead to multiple months of a bullish wave/relief rally... Good in any case.
Namaste.

LRC/usdtperpshort position
we are in down trend/chanell
sell 0.254
tp 0.238
good luck
plz trade your plan

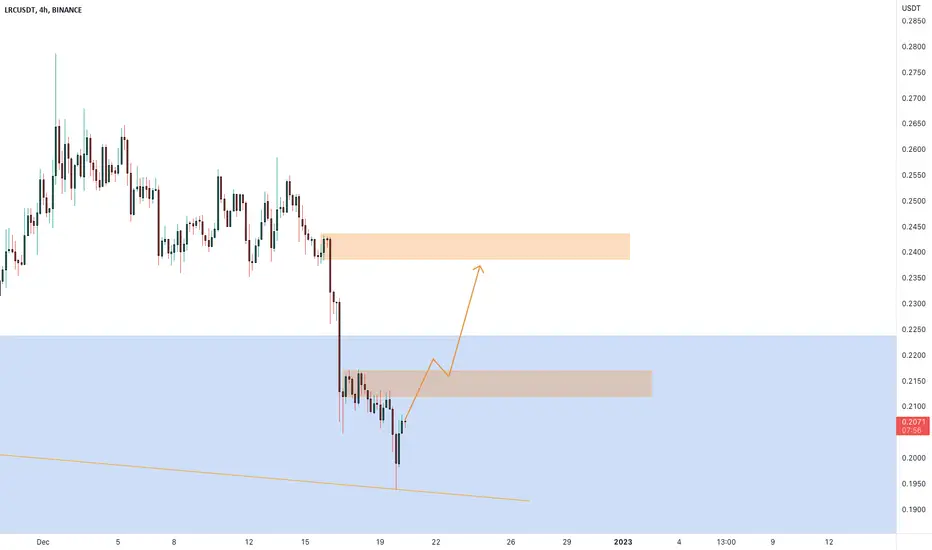
LRCUSDT is testing the local resistancethe price is testing the daily support on the 0.19$ area, where the market has the demand zone
how to approach it?
IF the price is going to have a breakout from the local resistance we could see a pullback until 0.24$ area
According to Plancton's strategy , we can set a nice order
–––––
Keep in mind.
🟣 Purple structure -> Monthly structure.
🔴 Red structure -> Weekly structure.
🔵 Blue structure -> Daily structure.
🟡 Yellow structure -> 4h structure.
⚫️ black structure -> <= 1h structure.
–––––
Follow the Shrimp 🦐
LRCUSDT -1DIn the daily time frame, we see the wedge pattern and if the ceiling of the wedge breaks, we expect a pump of this currency

LRCIdea: The price is trying to form a bullish cup and handle pattern. The price must consolidate above the daily 50 MAs for the pattern to be confirmed, otherwise the downtrend will continue.


LRC usdt let's dip our toes.market has been frantic so i chose not to trade as much the past few days.
this is a pretty small risk trade and i am will to take it.
i will short LRC at 0.2485
take profit
0.2468
0.2454
0.2443
stop loss if 15m candle closes above 0.2495
you have to keep an eye on it since it is on a 15 minute timerframe
FOLLOW FOR MORE

LRCUSDT - SETUPLRCUSDT price is trying to break above the falling trendline and now trying to move up. The bulls are trying to break $0.27 in this move. So we are expecting good momentum, trade accordingly.


LRCUSDTHello Crypto Lovers,
Mars Signals team wishes you high profits.
This is a 4-hour-time frame analysis for LRCUSDT
In the current chart you observe R2 and R1 on the top as the resistance areas that express the price was not able to rise at some points. S1 used to be another resistance line and S2 is a support line which includes the well support of price. Presently, we have the fluctuation of price in R1 area and we expect two options to happen here. Either the price provides us some rising sings and through these confirmation candles, a rise is predicted for the price to reach R2 area. Or we will have some falling signs there and it means that the price loses the support and starts a falling trend down to S2 or lower. Please remember to activate your stop-loss points due to the unstable situation of market.
Warning: This is just a suggestion and we do not guarantee profits. We advise you to analyze the chart before opening any positions.
Wish you luck

#LRC/USDT PARALLEL BREAKOUT AND RETEST READY TO PUMP 1200%Welcome to this quick LRC/USDT analysis.
I have tried to bring the best possible outcome to this chart.
Show some support, hit the like button, and comment in the comment section. this motivates me to bring this kind of chart analysis on regular basis.
SPOT CALL
Hold it for a long time to come, it can give good profit, as BTC will pump, all the calls will give you good profit and most important stop loss
Entry:- CMP $0.2400
Stoploss:- $0.2400
Target:- $0.4000, $0.5000, $0.6750, $0.9780, $1.31, $1.66, $2,$2.67, $3.77
Remember:-This is not a piece of financial advice. All investment made by me is at my own risk and I am held responsible for my own profit and losses. So, do your own research before investing in this trade.
Happy trading.
Sorry for my English it is not my native language.
Hit the like button if you like it and share your charts in the comments section.
Thank you...

Loopring LRC Crypto Market after the ElectionsMy forecast is that we will see a bearish outcome for the crypto market after the November 8th Elections, especially for Loopring LRC, which is overvalued.
LRC/USDT short
Entry Range: $0.34 - 0.37
Price Target 1: $0.33
Price Target 2: $0.30
Price Target 3: $0.28
Stop Loss: $0.43

LRC LONG SCALP LEVELSLRC USDT PERP BINANCE LONG SCALP LEVELS
* Each level marked on the chart should give a (little) bounce, perfect to plan some scalp trades

LRCusdt crit chartremember now after pump not ok for buy
i think best is sec Entry point for can buy and not miss
i think have potentiale for touch 3 EntryPoint but little risky and can chart cntinue for up but need pullback on EntryPoints
so now can going up but not good for buy this more go up u cant got more rewards for BTC close to little Fix
so better wait on Entry Point buy
but now have more liqudity for continue
GL
EntryPoint:
0.3546
0.3160 (Good supp and good Entry)
0.2877
Supports:
0.2619
0.2292
0.1934
Resistance:
0.4140
Targets:
0.5842
0.7719
1.0200
MidTime:
1.5162
2.5111
HODL:
4.7739
6.6681
GOAL:
10.8077
GL

the correction is completeAs you saw yesterday, I posted the analysis to lrc as if it would decrease, and so it was! At the given moment, the correction seems to have ended and WAVE 5 is following until the approximate price of $0.45-0.46

Short term sell off! I don't know when the bullish trend is going to end but we can definitely set a futures target to support level shown!
Be aware crypto trading is highly risky!

short short short
lrc will drop to the area of $3.1-3.4
in order to have a new growth, it must decrease until there.

LRC : CAN BE THE HIGHSTE % BREAKOUT IN TOP 100 COINS SHORT TERMWe did study the LRC and found some patterns on it that can show the historical price action of 2021
The coin did increase by 766% to the top.
And it seems That LRC can get the breakout of the top 100 coins.
This is as we did scan all the top 100 coins
The most important target is $0,83
In highest range that this coin can go is above 2 USD.
Never enter a trade before you have studied it well and that you did confirm it.
This is our view about the coin since we did confirm some trends and not trading advice.
Know that some gains can take time.
If you are a day trader, never trade without SL.
we choose it depending on Algorithmic trading and the pattern view that we have about it.
So let's see or we can see soon the $0,83 first target.

RLC : DAY TRADELRC showing some effects that can change to new volume with day trading.
Above 0,33 expecting.
