ABC BullishThis one looks to be improving technically..
Long entry is set at the point where price breaks the CD leg in an uptrend. The break out level is subjective as folks idea of an uptrend can differ person to person. It is hard to set a long entry level before this level has been set. I usually try to place it over obvious resistance.
ABC patterns are corrective patterns and D is the target..so it is an ABCD formation. It is consuidered a measured move down. Targets are calculated using the AB leg and fibonacci levels..
I use 0.38, 0.62, 0.79. If the market is still bullish , price can reach the 1.27 and 1.61 levels and these are usually targets 2. Some folks also use 100% AB.
When price hits D, it is time to sell. I do not put D in the pattern name because it is not there yet (Someone asked me that)
This is considered a harmonic pattern , as it repeats itself over and over in the market. There is also a bearish ABC pattern and a bearish ABC pattern considered a measured move up.
Not a recommendation
0A3U trade ideas

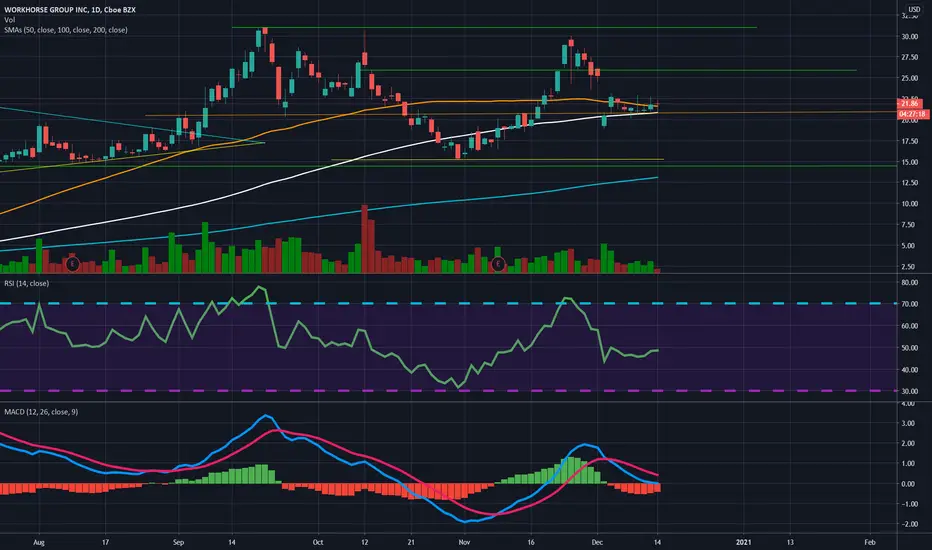
WKHS in lateralization modeWKHS appears to be in a stabilization phase with longer than expected.
Despite the low production of vehicles expected for the next year (1,500 trucks) any new news would send the action to its previous levels.
Its resistance is 40% higher at around $ 30 which is a good incentive to take a chance.
The trend in the 35-period MA of the OBV shows a slight recovery and a smooth inflow of capital into the stock.
In any case, it would not be a bad idea to have a stoploss close to $ 20 in case traders lose their patience and decide to sell. It is a good precaution.
Regardless of what has been said, I maintain my optimism

WKHS Possible ReversalAppears to be in an island reversal. Watching for a breakaway gap from the box. Additionally, it appears the top of the box is a key level of previous support and resistance ($22.90 ish), with swing lows getting higher. My entry will be a gap up from this level with significant volume or after the break of resistance with a pullback to the $22.90 level confirming support.
Beware: WKHS is burning through cash and needs to raise again. Any bullish run will be a quick trade for me. A pump leading to an offering sounds realistic.

cup and handle on WKHSnice cup and handle formed. not sure if its gonna matter or not without the USPS contract but WKHS is still getting other contracts and is expected to still get the USPS contract. time will tell on this one.

WKHS 1H TRIANGLE BREAKOUTTriangleS are repeatable trading chart patterns.
Triangles are consolidation chart patterns that can breakout either direction.
Each chart pattern will have defining trendlines of the support/resistance levels creating the pattern.
What ever time frame you are trading this chart pattern, wait for a candle close outside of the trendline in the direction of the breakout candle. (Our time frame preference is the Daily chart ).
Add volume indicator - Volume is the amount of $ that went into a particular candle or in Forex the # of trades that took place.
Add ATR indicator - Volatility is the amount of price movement that occurred. Use the ATR to measure the price movement.
When you see descending Volume bars and descending ATR line (which indicates volatility ) this shows
a dis-interest in traders to invest in this pair creating consolidation which creates the chart pattern.
Trade Management after there is a breakout candle close.
1 - Position size (compare volume bar to volume ma line).
a - Breakout candle must be 100% of volume average for a full position size.
b - If 75% of volume average then ½ position size. (To find 75% of Volume
look at the charts volume settings – divide smaller # into larger # = 75%+)
If not 75% then stand aside from the trade.
2 – If candle breaks out of a trendline, 15m before the close of the day prepare your buy/sell order.
Enter two trades. 1st trade will have a SL & TP. It will close automatically when the 1st TP is hit. 2nd
trade only has a SL and will be allowed to run. When 1st TP is hit move the SL to breakeven. Look
at ATR and prepare SL at 1.5 of ATR. Prepare 1st trade TP at 1 of ATR.
3 - SL for both trades will be 1.5 x ATR.
4 - 1st trade TP will be 1 x ATR.
5 - No TP on 2nd trade – letting profit run and adjusting SL to follow price.
6 - When 1st TP hit – move 2nd trade SL to breakeven.
7 - Adjust the 2nd trade SL to follow price.
*8 – After Breakout candle – if price closes back into chart pattern close trade don't wait for SL to be hit.
*9 - When breakout candle is more than 1 ATR from breakout candle open.
a - Enter 1st trade at candle close with ½ position size.
b - Enter 2nd trade with a pending limit order that is 1 ATR of breakout candle open.
c – Price should pullback to that pending limit order for 2nd trade.
d – If Price returns back into chart pattern close trade before SL is hit.
This trade post was provided by Ben Losier from TSG. Thanks Ben

wkhs is hangin in there....WKHS is squeezing underneath the 12/26/50 day ema's. Price should choose a direction soon. 200 day ema is inside consolidation and key to how WKHS price will carry on. Break below the 200 day ema and there's a good probability of a larger fall.


#WKHS Ready To Work. #WKHS about to go to work. Squeeze indicator on the 4hr. large Inverse Head and Shoulder formation retesting prior resistance...RSI with bullish divergence just the way your mom likes it. momentum turning up to complete the right shoulder... + gap fill at $25.50 zone. I'm sitting on 4 options and 20 shares. Put me in Coach!

Workhorse - Giddy Up!After a MONSTER win on Slack ( WORK ) now we're on to a new horse - WKHS .
We'll keep this analysis long and simple. Ha! We're buying stock (avg 19.70) and Jan 20C ($3.00) at this gap down to the T-Line following an Extreme Turn on the 4H.


Lets see if it bounces off the 50 SMA. WKHS looks to be bouncing off the 50 sma line. Will consider adding to my position, but i am comfortable with my current position.
ABC BullishWKHS has definitely been struggling..
ABC bullish is an ABC/D sort of pattern but D is not here yet..so I call it ABC..lol..It is a corrective pattern and is a measured move down..
Targets are calculated using the AB leg and fib levels then added to the long entry level..
NV has been decreasing since price hit 11.90ish.OBV is high and short interest is low..no rising wedges in the yearly chart..RSI is tilted up and the stock is not overbought...monthly candle is a red hammer and weekly is a doji..the 5 MA crossed down through the 20 MA a few days ago and is tilted down. The 50 MA is tilted down. The 100 and 200 are pointing up. If I look at moving averages, then it looks like this one may struggle a bit more...time will tell..
Ichimoku cloud also indicates a tough time in the near future but then the cloud turns green..be careful with your entry and good luck!
Not a recommendation
Happy Holidays!


Trend on WKHSIf someone wants to buy WKHS I would expect it to bounce off its support around $ 19.
From there to his bounce to $ 25 at least based on his collarbone (Double bottom pattern)
That would be like a 35% profit

Bullish swing in 1hr chart!Fundamental news and bullish swing in the same day! First target 21 (200 SMA) on hourly chart!


My Analysis for Work Horse - Buy within one weekHi,
I believe workhorse is about to take off within one week.

Workhorse about to hit new hit - Buy within the Next WeekHi,
I am an avid fan of Technology companies and any products that are related to automotive driving. I have been watch Workhorse for awhile and I believe it will hit new highs in the upcoming future. I am planning an entry in ONE week from today. Always remember entry is very important!

$WKHS Swing Trade IdeaWKHS hit resistance at $30 area, then got hammered more when USPS delayed the contract with WKHS.
Since then WKHS has broken through the daily 20ema, there was a nice bounce today from $19 area but don't see any reason it can hold this level and not continue dropping to $15-$17 area.
$15-$17 area is where our POC on volume profile is, if we can get $14, great value add for a swing trade to the long side, for now, short side might be more juicy.
Will see how this one goes tomorrow.
Will update with a new idea when WKHS approaches POC for a swing trade to the upside.


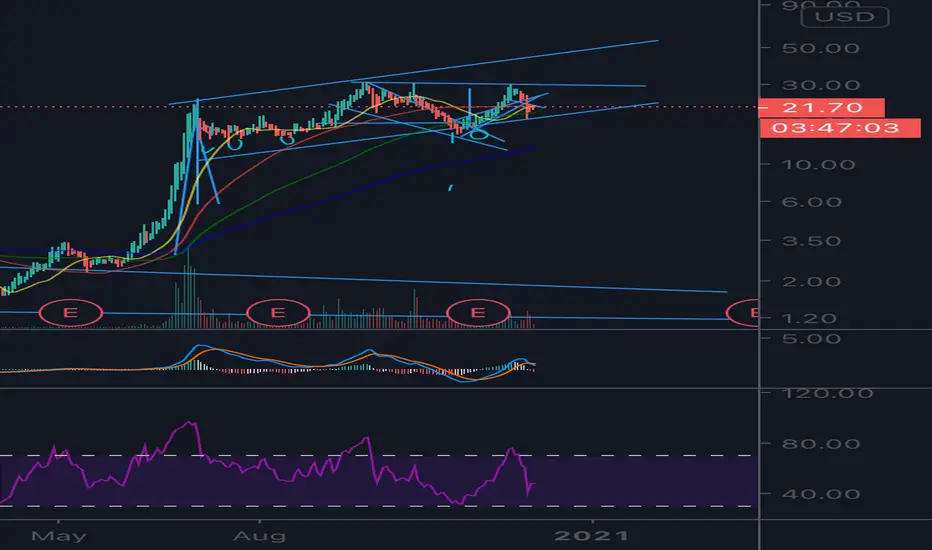
WKHSDispute the recent news of delaying the further WKhS plans, it all falls in alignment with the old ATH resistance of 30$ and a test of masive resistance at then top of the bull flag pattern I am seeing. In my opinion, this consildation should leave these 30$ peaks in the dust as we eventually break out into new all time highs. Keep an eye on WKhS
Failed C&H Double BottomBad news sent this one way downdown ..and now there is resistance overhead..the lower highs could have been a signal for a rough time..
The cup and handle pattern was trying to form and now it is under the handle low and mid cup as well so that pattern is invalidated..
Targets listed are only valid if C&H manages to reform and price hits long entry level..
2 key support levels broken.. )o: Guess computer trading kicked in on the news and massive sell
Just watching
