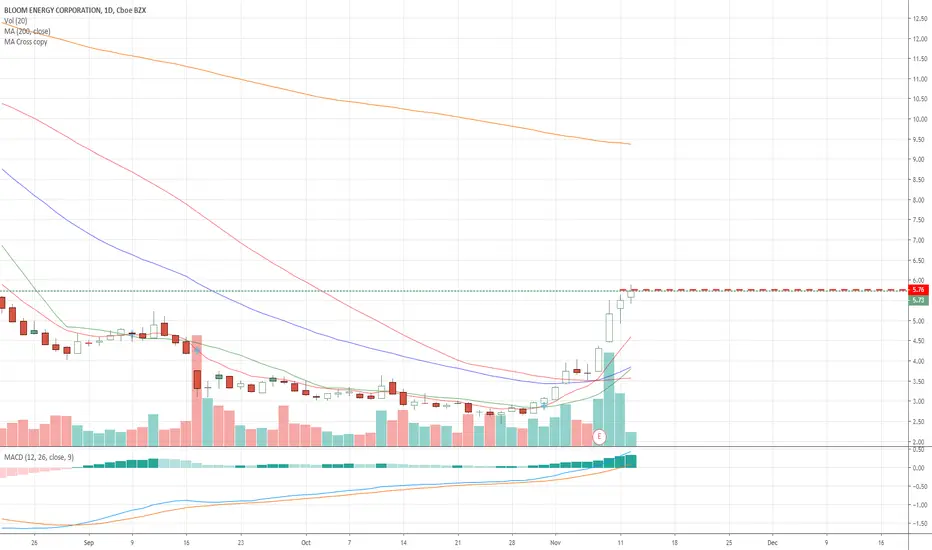
On the door steps of big move?All in the chart .Thanks for your time.Please comment .
P.S.I am not abandoning my previous chart about 2nd wave of covid 19 (that one so far was a miss),but my all other BE charts are relatively accurate, please review and play if you wish-links are below.
0A4L trade ideas

BE to 12$seekingalpha.com
They just made an agreement to form a cell powered ship to reduce carbon emissions. Thats awesome but when it will come true is a tough one. Long term this will probably be a good buy. My expectation for their next high is 12$. It rallied today and hopefully no one sells tomorrow but the volume increased today so that showed a nice interest. If it pulls back im looking for a bounce at 9.66 to see if it can hold as new support. If it holds and bounces back up then hopefully it can surpass its daily high (june 30th) at 11.07. Its a good stock and energy is always a good buy but I wouldnt hop in until we get that new support. Thats all though.
Good luck
trade smart
this is not financial advice. I am new and I am learning. apologies if this does not come true :)
also note not seeing any bullish patterns so that is why im waiting for a new support


Possible 2nd waive sell off?Were There Multiple Waves During The 1918 Influenza Epidemic?
There were at least three distinct waves of influenza in 1918 and 1919, which killed an estimated 50 million people worldwide. The pandemic was simultaneous with World War I, and the war is believed to have spread the virus around the globe more quickly than it otherwise would have.
The first wave began in March 1918 and eased by the summer. The second wave came in the fall, followed by a third wave during the winter and spring of 1919.The first wave “was not very deadly,” said J. Alexander Navarro, assistant director of the Center for the History of Medicine at the University of Michigan. “It was about as bad as ordinary strains of seasonal influenza that had been circulating up until that point.”
The second wave was the deadliest, and that may have been due to mutations that increased the virus’s lethality, although scientists say this is speculative and that such mutations more typically take much longer to develop and spread.
The second wave “slowed towards the end of November, in part because more stringent social distancing measures were put in place,” said Kenneth Davis, author of “More Deadly Than War: The Hidden History of the Spanish Flu and the First World War.” “When those were relaxed, a third wave commenced in the winter and spring of 1919.”
The third wave lasted into early March, and some suggest there was a fourth wave during the winter of 1920. Each was less deadly than the one before it, Navarro said, although there were regional differences in severity.
The decline in lethality after the second wave was probably shaped in part by the declining number of people who hadn’t already been infected, Navarro said. When infections in a population become sufficiently widespread, that can slow the further spread due to “herd immunity.How Much Can The 1918 Pandemic Tell Us About What To Expect Now?
While both pandemics involved an easily transmissible respiratory disease, there are some important differences that make the 1918 pandemic less helpful in predicting the course of the novel coronavirus.
One is that the 1918 outbreak involved influenza, which is caused by a different family of viruses than the coronavirus. This brings both good and bad news.
On the positive side, the coronavirus appears to be much more stable than the influenza virus, and thus less likely to mutate into a more deadly variant, said Ravina Kullar, an infectious disease specialist and adjunct faculty member at UCLA. The coronavirus’s “spike protein,” which enables it to attach to human cells and attack them, appears to be especially resistant to mutation.
On the downside, the coronavirus doesn’t seem to have a significant seasonal aspect. Influenza worsens as the weather gets colder but eases up during the warmer months. While we may have seen a reduction in coronavirus infections in recent weeks because more human interactions are moving outdoors, scientists don’t expect the same scale of seasonal drop-off for the coronavirus.
“What we’re seeing right now is that it’s not impacted by the climate,” Kullar said. “Warm and humid places like Mumbai and Indonesia have struggled with the virus, and in the United States, cases are rising in hot states like Arizona and Florida.”
The patterns in mutations and seasonality suggest that the coronavirus may not follow the wave patterns of the 1918 flu. Instead, the spread of the coronavirus may follow something more like a plateau, with spikes possible if social distancing isn’t adhered to fully.
There are other differences between now and 1918.
On the upside, we now know much more about viruses and public health, and science is able to devise targeted treatments and vaccines.
On the other hand, the world’s population is bigger and more densely packed. In 1918, the world’s population was smaller than 2 billion, while today it’s about 7.6 billion. Today, we also have commercial aviation, which can carry infected people around the world far faster than trains and ships could in 1918.
A bigger, denser, more mobile population means a greater chance for a virus to continue spreading.
In 1918, some cities saw an easing of the pandemic once they neared herd immunity, but that’s not going to be as helpful with the coronavirus. Because the coronavirus is more infectious than the 1918 virus, the percentage of the population needed to reach herd immunity has to be about 65% today, compared with about 35% in 1918.
“In 1918, they could get through the pandemic more quickly because of that, and even so, they did it with a staggering death toll,” Navarro said. “Today, the coronavirus will be with us for a lot longer.”
What Factors Could Cause A New Wave?
The biggest risk, scientists say, is a loosening of social distancing measures.
A much larger portion of the economy today is engaged in consumer-driven commerce such as the restaurant and entertainment sector. This heightens the economic pressure to relax social distancing standards. But doing so could worsen the pandemic.
“In 1918, once measures were lifted, the population very quickly went back to life as normal, flocking to movies, shops and stores, dance halls and saloons,” Navarro said. “That led to another spike of cases in many cities.”
Nichols said a community’s past experience with the virus can make a difference.
In Boston, where Nichols is based, “the first wave was relatively severe, and many people know someone who was personally affected by COVID or had a COVID-related death in the family,” she said. “That affects people’s behavior. In areas where epidemic growth has been slow, the urgency of changing one’s behavior is less.”
Nichols added that experiencing the summer, when people have the freedom to interact outdoors, could make it harder to practice social distancing in the colder months.
“I fear that people will continue their summer socializing patterns into the fall and winter, turning very low-risk interactions into relatively high-risk interactions,” she said.

Possible next move on FridayDown to $8.22-$8.16 and then bounce up to ~$9.48 .Pure speculation , even tho my last two trend analysis on BE were spot on.

BE above $8.50 ,next target ~$9.40 area Let's see if we can hold above $8.50 ,if yes then move higher most likely will continue .

BE about to explode (?)I can be wrong but I think that we are about to witness explosion in price .If we break $8.50 level (which can potentially happen Monday),then the next move will be to~$9.40 and if momentum continue we can potentially hit $10.50,$11.60 and $13 mark .Thanks for your time.

buy this looks great the red line represents the resistance and that's also where I see the most struggle. but overall I see this stock as a buy, would be a great swing trade.

Bloom Energy LONG; $14 TGT - July 2020 Bloom Energy is set to take off.
Again, in 2019, California legacy utility Pacific Gas & Electric, or PG&E, failed to prevent wildfire outbreaks due to their aging infrastructure. Though Californians, and most Americans, have speculated that the company will solve their repeated issues -- they haven't even though they are desperately trying to.
That can only mean one thing: that the PG&E electricity infrastructure is far too expansive for the company to monitor or repair. Furthermore, it is too expensive and inconceivably labor intensive for PG&E to commission a taskforce to repair every short circuit or wiring issue present in their infrastructure otherwise they would have done so by now. It has made many, universities, schools, businesses, major facilities that require power around the clock, that grid power is far too unreliable. Enter Bloom Energy (BE), the company that provides versatile, natural gas-powered fuel cells that are connected to the grid yet independent from it. California and New York happen to be their largest markets!
When the power goes out/a part of the grid crashes/a power line in your area fails, the Bloom Energy (BE) servers will supplement the lack of electricity, generate its own, and power your facility. This fire fiasco has driven a 5x increase in inquiries for Bloom Energy (BE) servers and will drive a backlog going into FY2020. This is a major secular trend for the company that has been, thus far, stymied with legal issues and high research and development/overhead costs. Not only that, they have been developing servers to cut emissions for large ships, a major source of greenhouse gases, and now have a major client in Samsung. BE is set to go sky high!
PRICE TGT: $14 by July 2020

BE long ideaI bought BE here should run to the 200sma. It is above the supporting moving averages looks real good. Earnings is past and did better than expected.
BE DowntrendBloom has been on a massive / fast paced run since October, however a clear downtrend is still present, and the success (breaking the downtrend) or failure of this bull flag, will determine if the stock rises or falls. An island top is also present with a clear price gap.

Trade the gap in Bloom EnergyAverage analysts price target $11.86 | Overweight
23% short interest
Bloom Energy Corp. engages in the manufacture and installation of on-site distributed power generators. Its product, Bloom Energy Server, converts standard low-pressure natural gas or biogas into electricity through an electrochemical process without combustion. The company was founded by K. R. Sridhar, John Finn, Jim McElroy, Matthias Gottmann, and Dien Nguyen on January 18, 2001 and is headquartered in San Jose, CA.


$BE Price TargetsNYSE:BE restructured their company and began seeing changes in share value before this latest earnings. Right now, $BE is performing it's first major consolidation pattern since "the run" began on Oct 25th. Price has validated the daily and weekly support level of $6.00 and this support level should be the defining characteristic for all trade theory; a break below this support level would validate the alternate thesis. This market is no longer "trending" due to the current consolidation pattern. "Not trending" does not imply market failure; the current consolidation should be considered healthy market activity. This is a "newer" company with less than 5 years of chart data.
Theory : Long Positions Only
2019 price pivots:
Pivot One: $7.00 (top of current price box)
Pivot Two: $8.00 (top of Aug. gap, 1.23% fib level, daily and weekly resistance line, 50MA)
Personal preferred long options swing trade: Skewed Iron Condor (Premium Trade)
The skewed I.C. will swap the long risk to the short side, protecting our trade from an unusual long run in $BE. If this market expands beyond the expected move for Dec expiration, the skewed I.C. will ensure profits.
Concern: The skewed I.C. adds additional risk to the short side of this position. The breakeven price for this $BE trade is $6.40
SWING TRADE : SELL -1 IRON CONDOR BE 100 20 DEC 19 8/9/8/5 CALL/PUT @1.60 LMT
Trade Entry: Sell spread for $1.60
Trade Exit: Buy spread back for $1.20
( Target profit based on I.C. 25% strategy )
Swing Notes: The options trade presented represents a multi-leg options strategy developed with probabilities and "TA" trade logic. This is a "probability trade", suited for "less experienced" traders who are looking to grow their options portfolio and their skill level. This type of trade logic should only be attempted after you understand the trade and have an understanding of the risks included. This "swing" strategy WILL NOT be profitable in 5 days and will most likely take 10 - 14 days to see profits. This type of trade logic should only be attempted after paper trading the strategy and finding a consistent win rate. Please seek professional coaching before attempting to "go live" with your trades.
DAY TRADE ONE : BUY SHARES (intraday)
Take long positions with a fade strategy, utilizing runners to seek scaled out profit opportunities and exit the entire position by EOD
STRATEGIES:
ORB-Pivot breakout
ORB-5 minute breakout
Yesterdays high breakout
Fade Notes: While not as popular, the fade strategy is more suited to "less" experienced traders and offers opportunities for all market participants. This type of trade logic should be attempted ONLY after paper trading your strategy and finding a consistent win rate. Please seek professional coaching (or fully develop your own trade logic) before attempting to go "live" with your trades.
DAY TRADE TWO : BUY SHARES (intraday)
Take long positions with a scalp strategy, utilizing runners to seek scaled out profit opportunities. Exit entire position by EOD.
STRATEGIES:
Continuation Patterns
Scalp Notes : "scalping" as defined by Investopedia assumes trader takes an "overly large position" for a small price target. This type of trade logic utilizes advanced trade skills and should only be attempted by experienced traders who have perfected their scalping skills. While scalping is popular, the win rate is very low due to the inexperienced traders participating in "scalping strategies". Please seek professional coaching and paper trade your strategy before attempting to perform this trade.
Concerning data:
Float : 71.02M | Short Float : 33.49% | Short Ratio : 8.28 | Avg. Volume : 2.87M | I.V. Rank: 37 | I.V.: 93%
Short Interest Ratio Note:
The higher the short interest ratio, the higher the likelihood short sellers will help drive the price up. A short interest ratio of five (5) or better is a good indicator that short sellers might panic and instigate a potential short squeeze. This is where "scalping" potential exists. The anticipated situation will consist of short sellers riding this product higher and taking heat against their position. Once price breaks that $7.00 overhead resistance, these short sellers "could" begin to panic and buy back their positions to close the trade. Their activity increases the "buying" pressure and pushes price higher.
This product only has monthly options.
The bid / ask spread for these options is wide.
Dec and Feb have institutional trading activity, Jan does not (yet) have institutional activity.
The current implied volatility has room to increase farther (or "drift" higher). A rise in implied volatility will shunt or delay the decay in options premium, prolonging our time in the trade.
Broker ratings summary for $BE (stockbot.us)
Start Date: 09/29/2020 End Date: 11/30/2019 Consensus: 1.6017
Buy: 4 Hold: 3 Sell: 0 Overweight: 1 Underweight: 1
Price Targets for $BE - Updated : 2019-11-08 (stockbot.us)
PT Avg. PT High PT Low Number of Analysts
11.06 22 3.5 8
Alternate Thesis: If $BE breaks $6.00 support level the long position trade logic will be void.


Sometimes You Have ONE Candlestick OnlySo I hopped in and got out of this one perfectly. In at $5.15 and out at $5.55. This one was quick and easy. I wanted to see if it could push past resistance, but it did not. I was out like a crook with the bag lol. Good luck out there today guys.


Strong-Buy for Bloom EnergyAnalysis per request: This stock has the potential to double by the end of this year, and a further potential to triple by mid next year. Very straight forward technicals, simply watch the interplay around the 20 and 50 MAs (touching & half-crossings). 'Weekly' PSAR is likely to break next week. ADX is at its peak (reversing now) meaning selling has stopped and money is flowing back in. I wasn't able to find any negative indications for now (I'll keep an eye on it).

Bloom Energy before EarningsBE will report Earnings this week with an upside potential of 5 or higher (up to 6.4 w/ rally). Unless they report some really bad numbers, this is still a strong-buy. Depending on which highs the stock will take out next (H1, H2), we will be able to tell more precisely what the stock will do for the next few weeks ahead. With gold prices about to explode it's a great long-term investment regardless of short-term performance volatility.
Take note of two important things: First, target level 'T' must be broken to build a new bullish 'weekly' formation. Second, while this week's gap-up is not too much of a major issue, it would be of great benefit for the stock to quickly retrace under 3.35 and close it before Earnings. This would ensure a 100% upside and eliminate any remaining doubts. A small risk remains with the gap left open, but as long as it doesn't drop below 'L', even in a bad earnings report scenario, it's still considered a strong-buy.

BE [NYSE] Bloom Energy Corporation long.All description on the chart.
Please, don't forget to like and follow.
Thank you.

$BE Possible Long Term path (Bloom Energy)Looks like a possible path moving forward. RSI is way oversold and has formed a divergence on multiple time frames. MACD crossover is also looking good and supporting this idea.

BE =5.10 (BUY and HOLD) Pump and Dump - Bloom EnergyHi friends, this action just from my sheet, on the strategy of Pump and Dump.
Buy on 5.12$
Stop = $4.50
Profit = $10.66
Stop 11%
For profit 100%
The risk of a yield of around R=10
I really like such actions. especially when you realize that their potential is huge.
My experience, against technical indicators, and fundamental.....
THE ANALYSIS:
the screener shows that the timeframes are 1 hour, 1 week, and 1 month. Definitely sell the commodity.
Putting 1 month. technical expertise. Let's see. Personally, I Bought, although indicatory say the opposite....
What pokazet on Skinerror...
Summary: strong SELL
Chip. average: SELL Buy (3) Sell (9)
Technical indicators: ACTIVELY SELL Buy (1) Sell (6)
Turning points 17.08.2009 19:12 GMT
Name S3 S2 S1 Pivot point R1 R2 R3
Classic of 5.84 7,90 of 9.18 11,24 14,58 of 12.52 of 15.86
Fibonacci of 9.18 7,90 13,30 of 12.52 of 9.96 11,24 14,58
Clique of 9.84 at 9.53 10,14 11,06 11,24 of 10.76 at 11.37
Woody 5,44 7,70 of 8.78 the 11.04 12,12 of 14.38 and 15.46
Demark - - 8,53 10,92 11,87 - -
Technical indicators 17.08.2019 19:12 GMT
Name Value Action
RSI(14) 100,000 Overbought
STOCH(9,6) 22,293 Sell
STOCHRSI(14) 0.000 Oversold
MACD(12,26) 1,120 Buy
ADX(14) 20,310 Sell
Williams %R -97,916 Oversold
CCI(14) -98,2874 to Sell
ATR(14) 8,3886 High volatility
Highs/Lows(14) -8,2050 To Sell
Ultimate Oscillator 45,098 Sell
ROC 0.000 Neutral
Bull/Bear Power(13) -6,1400 Sell
Buy: 1
Selling: 6
Neutral: 1
Summary:strong SELL
Chip. average 17.08.2019 19:12 GMT
Period Simple Exponential
MA5 of 10.45 to Sell 9,30 to Sell
MA10 of 11.55 to Sell 12,78 Sell
MA20 11.32 Sell 16.03 Sell
MA50 is 4.53 Of 19.66 Buy Sell
MA100 2.26 Buy 21.24 Sell
MA200 1,13 Buy Of 22.12 to Sell
Buy: 3
Selling: 9
Summary:SELL
FUNDAMENTAL ANALYSIS:
1.) The income statement will BE
Gross profit TTM 11,53%
TTM operating margin -30.02%
TTM -42.08 profitability ratio%
Return on investment TTM -40.7%
Period up to: 31.03.2019 31.12.2018 30.06.2018 30.09.2018
Total income 200,71 213,61 190,19 168,88
Gross profit 15,76 17,25 23,39 32,77
Operating income -72.64 -88.18 -66.11 -5.25
Net profit -84,44 -99,78 -78,58 -45,68
2.) Balance sheet BE
The quick ratio MRQ of 1.89
The current ratio MRQ of 2.32
Total assets total liabilities
Period up to: 31.03.2019 31.12.2018 30.06.2018 30.09.2018
Total assets 1318,85 1389,67 1445,14 1157,74
Total liabilities 1424,29 1481,33 1530,12 1918,91
Total equity -105,44 -91,66 -84,97 -761,18
3.) Statement of cash flows BE
Cash flow per share TTM -2.57
Earnings per share TTM 7.05
Operating cash -1.51%
Period up to: 31.03.2019 31.12.2018 30.06.2018 30.09.2018
Period: 3 Months 12 Months 9 Months 6 Months
Cash from operating activities -4.17 -58.42 -13.65 -18.59
Cash used in investing activities is 95.11 -94,83 of 15.42 of 9.67
Cash used in financing activities -1.49 253.12 261.84 -21.83
Net cash change 89.45 99.87 263.61 -30.74
* In millions of USD (except for shares)

