Bullish Wolfe Wave on XRXWave Structure: The chart displays a 5-point structure typical of a Wolfe Wave:
Points 1, 2, 3, 4, and 5 align with the criteria for the pattern.
The line connecting points 1 and 4 represents the Potential Target Line (PTL), which forecasts the future price target.
Point 5 is crucial as it marks a potential reversal area, signaling a buy opportunity in bullish Wolfe Waves.
Key Levels:
Support: The price near the 5th point aligns with strong support within the trend channel.
Resistance: Key resistance zones are observed near $12.99 and $22.50, acting as medium- and long-term targets.
Indicators:
RSI (shown below the price chart) suggest divergence, where momentum weakens on a downtrend, indicating a potential reversal.
The green EMA200 represents dynamic resistance, and a break above it could confirm the bullish reversal.
Trade Idea
Entry Point: Near the current price of $9.17, where Point 5 of the Wolfe Wave is forming. This area serves as the optimal entry zone for a potential long trade.
Profit Targets:
First Target: $12.99 (intermediate resistance).
Second Target: $22.50 (aligned with the Wolfe Wave's PTL).
Stop Loss: Place the stop below the low of Point 5 (approximately $7.50) to limit downside risk.
Risk-Reward Ratio: Aiming for a ratio of at least 3:1, with upside potential significantly outweighing the downside.
Scenario Validation
If the price breaks above the moving average and sustains, it confirms the Wolfe Wave setup.
Failure to hold support near Point 5 invalidates the pattern, triggering the stop-loss level.
0A6Y trade ideas

XRX LongOur proprietary AI-driven stock prediction model has identified NASDAQ:XRX as a promising trade candidate. This setup meets our established criteria, which include:
1. RSI Divergence: Momentum indicators suggest a potential price reversal, with bullish divergence in RSI readings.
2. Decreasing ATR: A decline in volatility (ATR) indicates a more controlled price movement, reducing the likelihood of sudden adverse swings.
3. Positive Volume Profile: Recent volume patterns suggest accumulating interest, supporting the case for upward price momentum.
Trade Parameters:
+ Take-Profit: Determined by our “25UP” predictive model, tailored to capture optimal exit points amid evolving market conditions.
+ Stop-Loss: Set according to our “25DOWN” model, designed to proactively manage downside risk and preserve capital.

Bull Triangle plus Divergencea bullish pattern has been created. plus there is divergence. potential bullish move.

Is Xerox ready for a bounce at historical lows?Based on the monthly chart of Xerox (XRX), the stock is at a price level not seen in decades, indicating a significant historical support zone. Currently, the price is touching this support, creating the possibility of a technical rebound.
Key points of the analysis:
1. **Significant Support**: The current price is right at a support level that has held the price steady in the past. This often attracts buyers looking for a rebound.
2. **Descending Channel**: There is a clear descending channel on the chart, indicating that the prevailing trend has been bearish. However, the proximity of the price to support makes this a crucial moment to evaluate whether a trend reversal will occur.
3. **RSI and Volatility**: The RSI indicator at the bottom of the chart appears to be showing signs of oversold conditions. This could point to a potential rebound, as buyers may enter at these levels to take advantage of what they perceive as a cheap price.
4. **Candlestick Pattern**: It is important to wait for confirmation through candlesticks. A strong bullish candle on the monthly chart could signal a reversal.
### Recommendation:
- **Bullish Idea**: A possible entry could be considered if the price forms a clear bullish monthly candle, showing rejection of the current support level. The target could be the next resistance level, located near the moving average (SMA) seen on the chart.
- **Risk Management**: It's advisable to maintain a stop-loss just below the support level to limit risk in case the price continues to drop.
- **Confirmation Needed**: Clear reversal confirmation is still needed to consider a bullish trade, as a support break would lead to new lows.
In summary, Xerox is at a critical historical support area, and there are indications that a rebound may occur. However, confirmation through candlestick patterns and appropriate risk management are essential before taking a long position.

XRX Consolidation XRX is a company that has been gapping down and consolidating regularly over the past month. The MACD is showing that it is climbing back and the RSI is rising. The XRX has had bullish continuity for the Day, Week, and Month. All of these seem to indicate a potential for growth. Anything is possible. The red line is the stop loss and the white lines are the support and resistance lines. There is volume picking up over the past few days.

XRX On The Move?When looking at XRX I get an alert that it is breaking resistance at $14.14. So, when checking the time frame continuity we can see that it is bullish on the hour, day, week, and month. This gets the technical side looking like we may have a bullish play. So, time to make some support and resistance lines which will be the price targets. The stop loss line is the red line at $13.71 and let's see if this stock has the momentum to close the gap made after earnings.
There is much pressure of holders at the $16.72 range of VWAP and they are in the group that may want out at a break even price. So be patient with this one.
RSI is in the middle and climbing gradually, if this trend is broken. The MACD is showing strength to the upside. If it beats earnings in July, this could easily move back to the VWAP area making for a nice move to the targets. Let's watch and see.

XEROX: New Management & Potential InvestmentFundamentals:
- Xerox on March 2024 offered $50 million of 3.75% in Convertible Senior Notes due in 2030.
- I guess Xerox is getting into 3D printing and they are trying to "RE-INVENT" themselves. They have a heavy amount of cashflow. However, SMCI (Super Micro Computer) is a competitor and SMCI is booming as a leader in its industry.
- Xerox currently pays a 6% dividend.
- If Xerox improves, a small buy now with its 5.9% to 6% dividend re-investment won't hurt. Maybe there will be a May 2025 breakout. Perhaps a November 2024 Presidential Election breakout.
Technicals:
Monthly Chart:
Xerox has reached rock bottom again. Notice how Xerox likes to bottom in the same area every time there is a major market crisis. I circled areas where ichimoku gave late stage buy signals on a monthly chart and areas where I would have attempted to buy-and-hold based on the monthly chart. The vertical lines show bear markets or close to bear markets in the overall stock market, which seemed to drastically affect this stock.
Since 1983, Xerox always bottomed in the same area. Xerox bottomed in 2023.
The longest move up after Xerox hit the bottom is 4 to 5 years. If 2022 or 2023 is the bottom, then, Xerox has until 2026 to 2027 to finish rallying.
Weekly Chart:
A double bottom appears on the weekly chart with validating volume and DQ. The weekly chart already tells us to be alert for a buy now or around $20. And, also, if the price moves to 26.95, then that will be near a monthly buy.
uRd
stage 3 ichimoku pattern
MACD and MACD-Ichimoku above the water line
Comment:
-Price is currently in a 12ish/19ish box range.
- If Xerox improves, a small buy now with its 5.9% to 6% dividend re-investment won't hurt. They can pay me while they continue to R&D and innovate enough to bring up sales, growth and earnings. Maybe there will be a May 2025 breakout. Perhaps a November 2024 Presidential Election breakout.

Xerox Faces Headwinds in Q4 2023, CEO Prioritizes Simplification
Xerox Holdings Corp (NASDAQ: NASDAQ:XRX ) recently faced a challenging fourth quarter in 2023, marked by a 9.1% year-on-year decline in sales to $1.77 billion, falling short of the consensus estimate of $1.79 billion. The disappointing performance led to a drop in the company's stock as investors digested the numbers. Despite the hurdles, CEO Steve Bandrowczak remains optimistic, emphasizing the strategic importance of simplifying the business structure for long-term gains.
Sales and Earnings Overview:
The fiscal Q4 2023 saw Xerox's ( NASDAQ:XRX ) revenues decline by 10.6% at constant currency, with adjusted earnings per share (EPS) coming in at $0.43, missing the analyst consensus of $0.52. Equipment sales took a hit, dropping by 17.3%, while post-sale revenue experienced a 5.8% decline. Gross margin fell by 130 basis points year-on-year to 33.5%, with equipment margin showing a contrasting increase of 80 bps to 32.4%. Post-sale margin, however, declined by 210 bps to 34.0%.
Strategic Business Simplification:
Despite the revenue challenges, CEO Steve Bandrowczak highlighted the positive impact of steps taken to simplify Xerox's ( NASDAQ:XRX ) business structure. This strategic move resulted in a 170 basis points expansion in adjusted operating margin. Bandrowczak underscored the importance of these structural changes, emphasizing the need for the company to adapt and evolve to meet the demands of a dynamic market.
Operational Efficiency and Productivity Gains:
To counter the revenue dip, Xerox ( NASDAQ:XRX ) is focusing on stabilizing and strengthening its core Print business. The company aims to drive enterprise-wide efficiency and productivity gains through its new Global Business Services organization. This initiative reflects Xerox's ( NASDAQ:XRX ) commitment to staying agile in a rapidly changing business landscape and ensuring its operations are streamlined for future growth.
Future Outlook and Guidance:
Looking ahead to fiscal year 2024, Xerox ( NASDAQ:XRX ) expects revenue in the range of $6.54 billion to $6.68 billion, slightly below the consensus estimate of $6.71 billion. The company projects a free cash flow guidance of at least $600 million, indicating confidence in its ability to generate cash despite the challenging market conditions. Xerox ( NASDAQ:XRX ) anticipates an adjusted operating margin of at least 7.5%, signaling its commitment to achieving sustainable profitability.
Conclusion:
While Xerox ( NASDAQ:XRX ) faced headwinds in the fourth quarter of 2023, CEO Steve Bandrowczak's strategic vision and focus on business simplification provide a roadmap for future success. The company's commitment to operational efficiency, productivity gains, and capturing opportunities in Digital and IT Services reflects a forward-looking approach. Investors will be watching closely as Xerox ( NASDAQ:XRX ) navigates the evolving landscape, seeking signs of resilience and growth in the face of industry challenges.

Xerox Holdings Corp. (NASDAQ: $XRX) Facing Strong Resistance
NASDAQ:XRX stock is facing a strong resistance at $18.36, which is the 52-week high and the upper boundary of a descending triangle pattern.
NASDAQ:XRX stock is below its 50-day and 200-day moving averages of $18.36 and $18.45, respectively. The moving averages are also sloping downward, indicating a negative momentum.
NASDAQ:XRX has a low trading volume, which suggests a lack of interest and conviction among the traders and investors. The average volume for the past 10 days is $1.82 million, while the accumulated volume for today is $16.93 million. NASDAQ:XRX may test multiple Support level's before reaching new highs.

XRX StraddleBuy Oct-20-23 16 Puts @ 0.7 Limit to Open
Buy Oct-20-23 16 Calls @ 0.5 Limit to Open
Xerox at an important zone, aligned with Nasdaq for a move. Direction? Uncertain, hence a straddle.

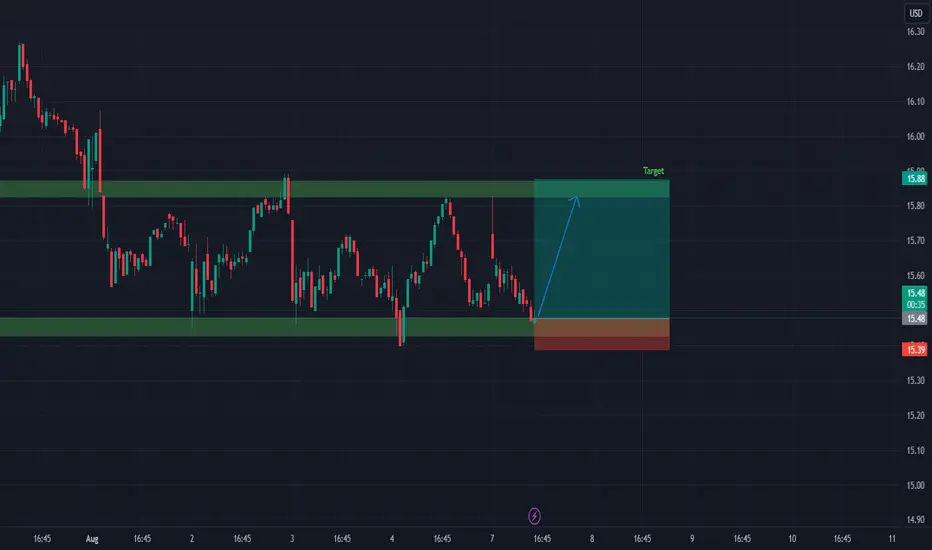
XRX Long PositionHi treders,
let´s have a look at XRX analysis.
It´s time to enter the long position and wait for the price to achieve the target.
Our estimated target is 15.88$.
Entry and stop loss are showed on the chart.
NASDAQ:XRX 13th FEBRUARY 2023NASDAQ:XRX is technically showing bullish indications:
1. Price breakout from trendline resistance.
2. Price retests above trendline resistance.
3. Micro trend forming bullish channel pattern
Bullish opportunity: 18 - 19.27 (as take profit)
Beware of the risk of potential bearish if it forms a lower low or false breakout below 16.33 - 15 (as stop loss)

Boomer Stock: XRX at multi-year supportXRX (Not entirely even sure what they even do anymore) hit a multi-year support level that's been strong since '82.
Dead stock or will it bounce back? Time will tell

Reversal Cup & Handle LongForming a nice cup and handle against the down trending XRX. Potential Reversal and a good entry area. C&H's generally a continuation pattern but they work on reversals as well.

Possible Buying Opportunity on XRXThere's a possible buying opportunity on XRX if the stock drops to around 20.50. Im looking to buy the April 2022 call around a range of .30 - .60 cents with a target of around 6 dollars with the expectation of lots of whipsaw activity around 3 dollars. any ideas or suggestions? many thanks

XEROX Weekly Technical Analysis XRX - Weekly - EDUCATIONAL only - Support, Resistance, Pitchfork , Fibonacci, Gap, Clusters - Hope it Helps, Good Luck
