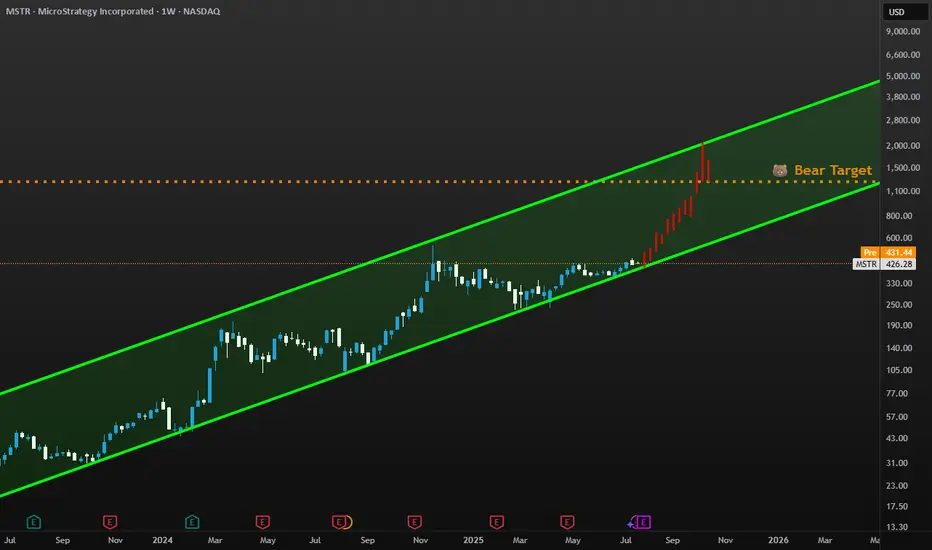
Possibility for MSTRIf bitcoin moves, Strategy moves.
I am no expert, so this is just for entertainment purposes.
But Strategy is acquiring bitcoin like there is no tomorrow and bitcoin inelastic supply tend to give a way to radical and fast grow in price.
Hence why I'd be keen to see MSTR move as much as I show in t
Next report date
—
Report period
—
EPS estimate
—
Revenue estimate
—
−21.8 USD
−1.17 B USD
463.46 M USD
263.35 M
About MicroStrategy
Sector
Industry
CEO
Phong Q. Le
Website
Headquarters
Vienna
Founded
1989
FIGI
BBG00ZMHBW16
MicroStrategy, Inc. engages in the provision of enterprise analytics and mobility software. The firm designs, develops, markets, and sells software platforms through licensing arrangements and cloud-based subscriptions and related services. Its product packages include Hyper. The company was founded by Michael J. Saylor and Sanjeev K. Bansal on November 17, 1989, and is headquartered in Vienna, VA.
Related stocks
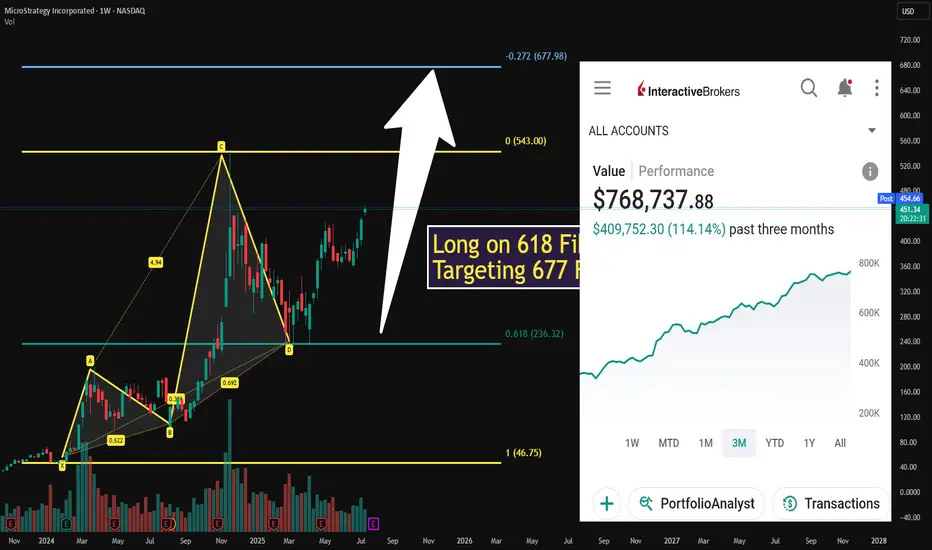
$MSTR ONCE IN A LIFETIME im up 400 GRAND!Targeting the 27.2 Extension with a MINIMUM target of 500
Do not LET OTHERS PUT U DOWN! I follow Fibonacci and I am up over 400k! FOLLOW UR SYSTEM!
I will alert my next buy here all I ask is drop a LIKE
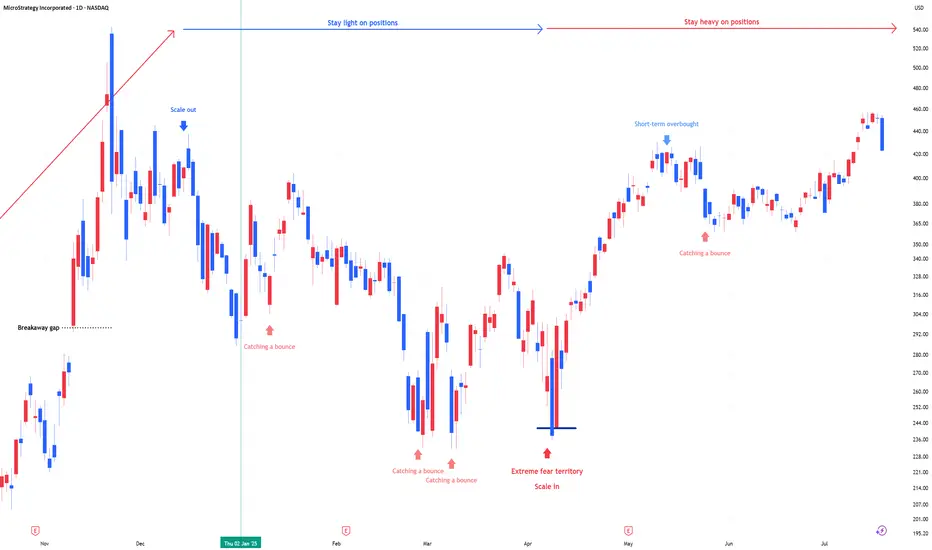
MSTR: Stay heavy on positions"MSTR position size is adjusted in line with US market and bitcoin signals for underweight or overweight allocations. During panic phases, 2x leverage ETFs are on the table."
Stay heavy on positions
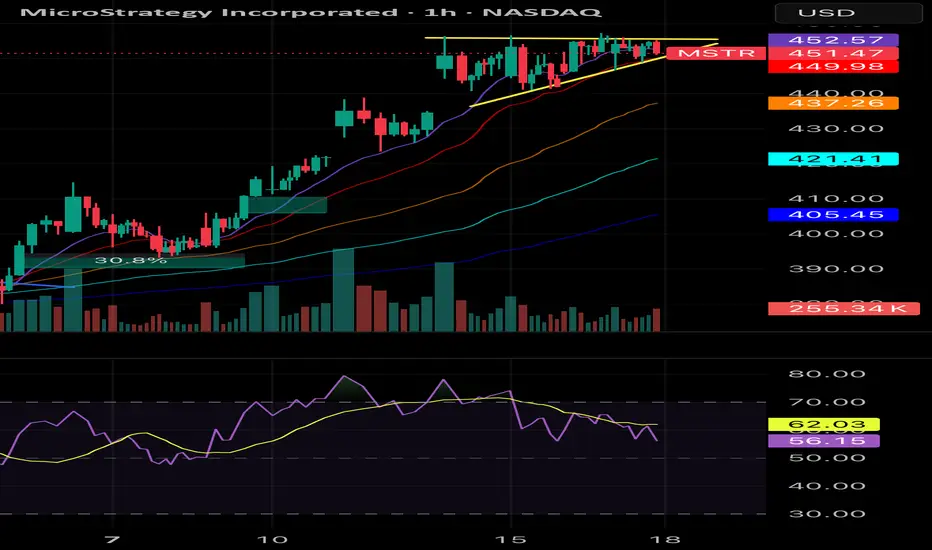
MSTR's ASCENDING TRIANGLEMstr appears to be in an ascending triangle. Broke out of a wedge I tracked a while ago, crypto is breaking out in general and bullish crypto legislation is being passed. MSTR thus has potential to breakout all the way up to 500 or more. nfa
MSTR - Microstrategy Short...for now.The White Fork is created by choosing point A, which must be the lowest price before the swing.
B and C are the natural high and low of the swing we want to measure.
What this gives us is a Pitchfork that projects the most probable path of price.
Additionally, with the three lines that make the F

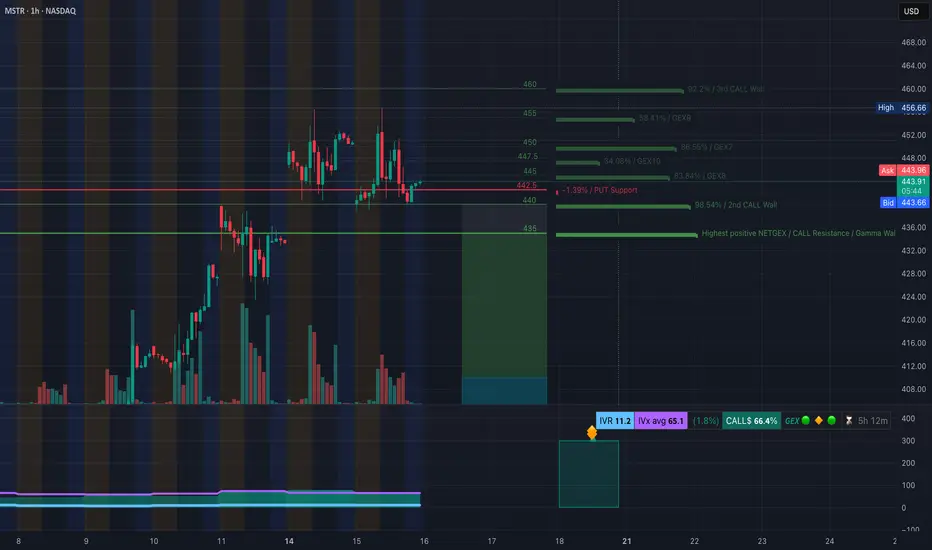
MSTR at Decision Zone! TA for July 16GEX + Price Structure Align for Breakout or Breakdown 🔸
🧠 GEX Levels & Options Sentiment (as of July 15, 2025)
* ⚠️ Key Call Resistance Levels:
• $460 (3rd Call Wall, 92.2%)
• $455 (58.41%)
• $447.5 (GEX10)
• $444.5 (GEX7) – overhead friction
* PUT Support Levels:
• $442.5 (near current price)
• $4
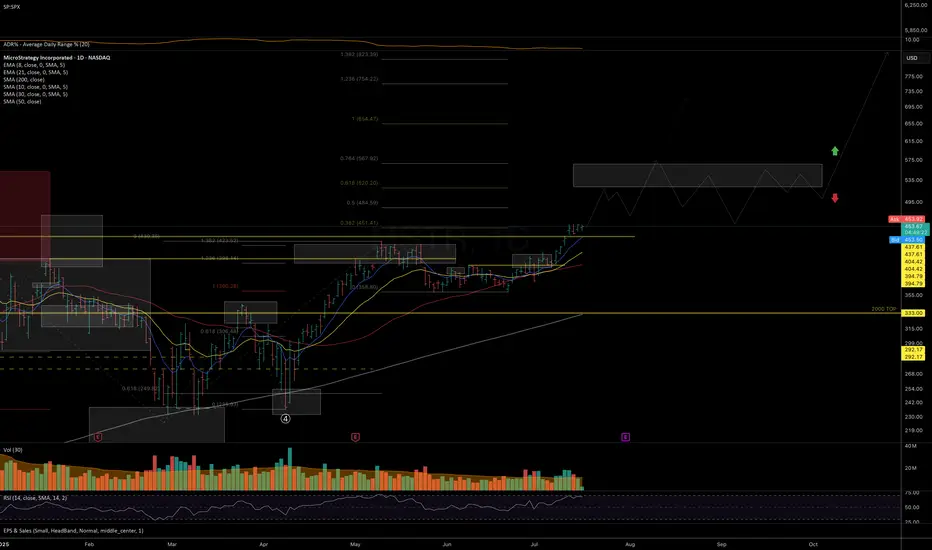
$MSTR: Long term bullish trendNASDAQ:MSTR long term signal triggered...
Up trend in monthly scale until end of 2025.
Heard it here first, lads.
Best of luck!
Cheers,
Ivan Labrie.

MSTR – On the Path to New ATHI was initially skeptical about the recovery structure unfolding since the April lows — it looked like a possible macro lower-high before deeper correction (as outlined in my previous idea).
However, given the strength in underlying #BTC price action (covered in my recent video-idea on crypto t
Strategy Finished Consolidating, New High With BTC Leading MicroStrategy (MSTR), the stock is currently demonstrating significant volatility and a strong correlation with Bitcoin's price movements, acting almost like a leveraged play on the cryptocurrency.
From a charting perspective, MSTR has been in a long-term bullish trend since its pivot to a Bitcoin

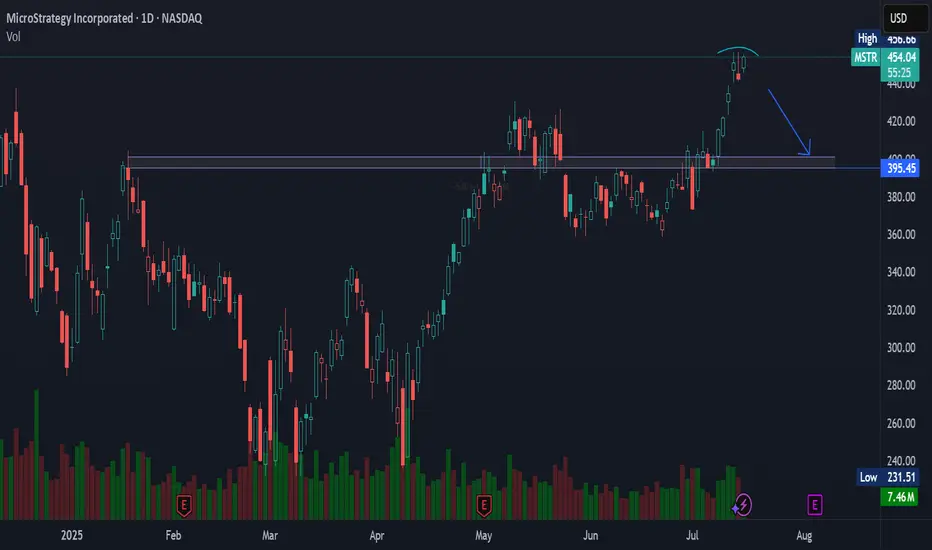
MSTR NASDAQ:MSTR looks like it’s gearing up for a pullback — eyes on the $395 level for a potential retest.
Watch the support. 👀📉
#MSTR #Bitcoin #Stocks #Tech #Trading
See all ideas
Summarizing what the indicators are suggesting.
Neutral
SellBuy
Strong sellStrong buy
Strong sellSellNeutralBuyStrong buy
Neutral
SellBuy
Strong sellStrong buy
Strong sellSellNeutralBuyStrong buy
Neutral
SellBuy
Strong sellStrong buy
Strong sellSellNeutralBuyStrong buy
An aggregate view of professional's ratings.
Neutral
SellBuy
Strong sellStrong buy
Strong sellSellNeutralBuyStrong buy
Neutral
SellBuy
Strong sellStrong buy
Strong sellSellNeutralBuyStrong buy
Neutral
SellBuy
Strong sellStrong buy
Strong sellSellNeutralBuyStrong buy
Displays a symbol's price movements over previous years to identify recurring trends.
MSTR5946535
MicroStrategy Incorporated 0.0% 01-DEC-2029Yield to maturity
5.77%
Maturity date
Dec 1, 2029
US594972AR2
MICROSTRAT. 24/29 CV ZOYield to maturity
0.67%
Maturity date
Dec 1, 2029
US594972AT8
MICROSTRAT. 25/30 CV ZOYield to maturity
−3.60%
Maturity date
Mar 1, 2030
US594972AN1
MICROSTRAT. 25/32 CVYield to maturity
−6.87%
Maturity date
Jun 15, 2032
MSTR6034213
MicroStrategy Incorporated 0.875% 15-MAR-2031Yield to maturity
−7.92%
Maturity date
Mar 15, 2031
MSTR6032672
MicroStrategy Incorporated 0.625% 15-MAR-2030Yield to maturity
−13.51%
Maturity date
Mar 15, 2030
US594972AP6
MICROSTRAT. 24/28 CV 144AYield to maturity
−18.02%
Maturity date
Sep 15, 2028
See all 0A7O bonds
Curated watchlists where 0A7O is featured.


Frequently Asked Questions
The current price of 0A7O is 412.8 USD — it has decreased by −0.65% in the past 24 hours. Watch MICROSTRATEGY COM USD0.001 CLASS A stock price performance more closely on the chart.
Depending on the exchange, the stock ticker may vary. For instance, on LSE exchange MICROSTRATEGY COM USD0.001 CLASS A stocks are traded under the ticker 0A7O.
0A7O stock has fallen by −8.61% compared to the previous week, the month change is a 9.88% rise, over the last year MICROSTRATEGY COM USD0.001 CLASS A has showed a 139.09% increase.
We've gathered analysts' opinions on MICROSTRATEGY COM USD0.001 CLASS A future price: according to them, 0A7O price has a max estimate of 680.00 USD and a min estimate of 200.00 USD. Watch 0A7O chart and read a more detailed MICROSTRATEGY COM USD0.001 CLASS A stock forecast: see what analysts think of MICROSTRATEGY COM USD0.001 CLASS A and suggest that you do with its stocks.
0A7O reached its all-time high on Nov 21, 2024 with the price of 547.6 USD, and its all-time low was 13.4 USD and was reached on Dec 30, 2022. View more price dynamics on 0A7O chart.
See other stocks reaching their highest and lowest prices.
See other stocks reaching their highest and lowest prices.
0A7O stock is 2.19% volatile and has beta coefficient of 1.25. Track MICROSTRATEGY COM USD0.001 CLASS A stock price on the chart and check out the list of the most volatile stocks — is MICROSTRATEGY COM USD0.001 CLASS A there?
Today MICROSTRATEGY COM USD0.001 CLASS A has the market capitalization of 115.09 B, it has increased by 8.10% over the last week.
Yes, you can track MICROSTRATEGY COM USD0.001 CLASS A financials in yearly and quarterly reports right on TradingView.
MICROSTRATEGY COM USD0.001 CLASS A is going to release the next earnings report on Jul 31, 2025. Keep track of upcoming events with our Earnings Calendar.
0A7O earnings for the last quarter are −16.49 USD per share, whereas the estimation was −2.44 USD resulting in a −575.42% surprise. The estimated earnings for the next quarter are −0.10 USD per share. See more details about MICROSTRATEGY COM USD0.001 CLASS A earnings.
MICROSTRATEGY COM USD0.001 CLASS A revenue for the last quarter amounts to 111.10 M USD, despite the estimated figure of 116.19 M USD. In the next quarter, revenue is expected to reach 113.65 M USD.
0A7O net income for the last quarter is −4.22 B USD, while the quarter before that showed −670.81 M USD of net income which accounts for −528.70% change. Track more MICROSTRATEGY COM USD0.001 CLASS A financial stats to get the full picture.
No, 0A7O doesn't pay any dividends to its shareholders. But don't worry, we've prepared a list of high-dividend stocks for you.
As of Jul 27, 2025, the company has 1.53 K employees. See our rating of the largest employees — is MICROSTRATEGY COM USD0.001 CLASS A on this list?
EBITDA measures a company's operating performance, its growth signifies an improvement in the efficiency of a company. MICROSTRATEGY COM USD0.001 CLASS A EBITDA is −36.52 M USD, and current EBITDA margin is −5.29%. See more stats in MICROSTRATEGY COM USD0.001 CLASS A financial statements.
Like other stocks, 0A7O shares are traded on stock exchanges, e.g. Nasdaq, Nyse, Euronext, and the easiest way to buy them is through an online stock broker. To do this, you need to open an account and follow a broker's procedures, then start trading. You can trade MICROSTRATEGY COM USD0.001 CLASS A stock right from TradingView charts — choose your broker and connect to your account.
Investing in stocks requires a comprehensive research: you should carefully study all the available data, e.g. company's financials, related news, and its technical analysis. So MICROSTRATEGY COM USD0.001 CLASS A technincal analysis shows the buy rating today, and its 1 week rating is buy. Since market conditions are prone to changes, it's worth looking a bit further into the future — according to the 1 month rating MICROSTRATEGY COM USD0.001 CLASS A stock shows the strong buy signal. See more of MICROSTRATEGY COM USD0.001 CLASS A technicals for a more comprehensive analysis.
If you're still not sure, try looking for inspiration in our curated watchlists.
If you're still not sure, try looking for inspiration in our curated watchlists.