Airbnb (NASDAQ:ABNB) Worth WatchingFor beginners, it can seem like a good idea (and an exciting prospect) to buy a company that tells a good story to investors, even if it currently lacks a track record of revenue and profit. Sometimes these stories can cloud the minds of investors, leading them to invest with their emotions rather than on the merit of good company fundamentals. Loss-making companies are always racing against time to reach financial sustainability, so investors in these companies may be taking on more risk than they should.
Despite being in the age of tech-stock blue-sky investing, many investors still adopt a more traditional strategy; buying shares in profitable companies like Airbnb (NASDAQ:ABNB). While profit isn't the sole metric that should be considered when investing, it's worth recognising businesses that can consistently produce it.
Airbnb's Improving Profits
In the last three years Airbnb's earnings per share took off; so much so that it's a bit disingenuous to use these figures to try and deduce long term estimates. Thus, it makes sense to focus on more recent growth rates, instead. Impressively, Airbnb's EPS catapulted from US$1.98 to US$3.60, over the last year. It's a rarity to see 82% year-on-year growth like that.
Top-line growth is a great indicator that growth is sustainable, and combined with a high earnings before interest and taxation (EBIT) margin, it's a great way for a company to maintain a competitive advantage in the market. The music to the ears of Airbnb shareholders is that EBIT margins have grown from 19% to 22% in the last 12 months and revenues are on an upwards trend as well. Both of which are great metrics to check off for potential growth.
Are Airbnb Insiders Aligned With All Shareholders?
We would not expect to see insiders owning a large percentage of a US$80b company like Airbnb. But thanks to their investment in the company, it's pleasing to see that there are still incentives to align their actions with the shareholders. We note that their impressive stake in the company is worth US$23b. Coming in at 29% of the business, that holding gives insiders a lot of influence, and plenty of reason to generate value for shareholders. Looking very optimistic for investors.
While it's always good to see some strong conviction in the company from insiders through heavy investment, it's also important for shareholders to ask if management compensation policies are reasonable. A brief analysis of the CEO compensation suggests they are. The median total compensation for CEOs of companies similar in size to Airbnb, with market caps over US$8.0b, is around US$12m.
The Airbnb CEO received total compensation of just US$311k in the year to December 2022. That looks like a modest pay packet, and may hint at a certain respect for the interests of shareholders. CEO remuneration levels are not the most important metric for investors, but when the pay is modest, that does support enhanced alignment between the CEO and the ordinary shareholders. Generally, arguments can be made that reasonable pay levels attest to good decision-making.
Is Airbnb Worth Keeping An Eye On?
Airbnb's earnings per share growth have been climbing higher at an appreciable rate. The cherry on top is that insiders own a bucket-load of shares, and the CEO pay seems really quite reasonable. The drastic earnings growth indicates the business is going from strength to strength. Hopefully a trend that continues well into the future. Big growth can make big winners, so the writing on the wall tells us that Airbnb is worth considering carefully. Now, you could try to make up your mind on Airbnb by focusing on just these factors, or you could also consider how its price-to-earnings ratio compares to other companies in its industry.
0A8C trade ideas

Pigs get fed, hogs get slaughtered #ABNB vs #Nasdaq100During the most inflationary time since the Weimar Republic the asset light concept is proving to challenging as the cost of money increases and the margins decrease two stocks suffering from this are #ABNB which has lost 19% over the last 3 months.
Higher interest rates and inflation have left consumers with less disposable income, as per the recent announcement from @elon_musk in relation to expansion of the manufacturing capacity in Mexico.
#ABNB has proven a broken model where hidden margins are expressed as cleaning fees. In real local fees these are price gauging and in many cases higher than the base for the asset use, the model is broken.
When compared to #NASDAQ100 or in the case #UBER which provides an alternative and preferred transportation model for the target demographic the superiority of the ride share model becomes clear.
We are short #ABNB and neutral on #UBER preferring the second as an asset light component into our master portfolio.

It is the time to buy ABNB for me nowHere is my Simple analysis about buying $ABNB.
As shown on the chart the stock is moving up and making HH and HL since December 22,
And now it is on the HL trend line and it seems that it respecting its trend line.
My Opening positions price is 125 USD
Frist Target is 140 USD
Second Target 150 USD
My final Target 175 USD
Stop Loss is any one hour close below 122 USD
Share ME you Opinion about Airbnb

Historical Buy Range for AirBnBAirBnb appears to be consolidating in a buy range ahead of getting listed into the S&P500

Airbnb huge selling volumehi Traders
Let´s have a look at ABNB
According to SEC Filing Joseph Gebbia 10% Owner, sold 166,667 shares worth $24,214,088. This was 13% of his all ABNB shares. This information was folowed by the biggest sell volume in Airbnb history. This year ABNB insiders: CEOs, CTOs, CFOs, Directors had only sell positions in their own company.
Current sell volume was not yet matched by price downfall so it can be expected even today.
Consider entry at current price.
Target price at first support line at 130.00
Put stop loss at Friday open price at 143.50

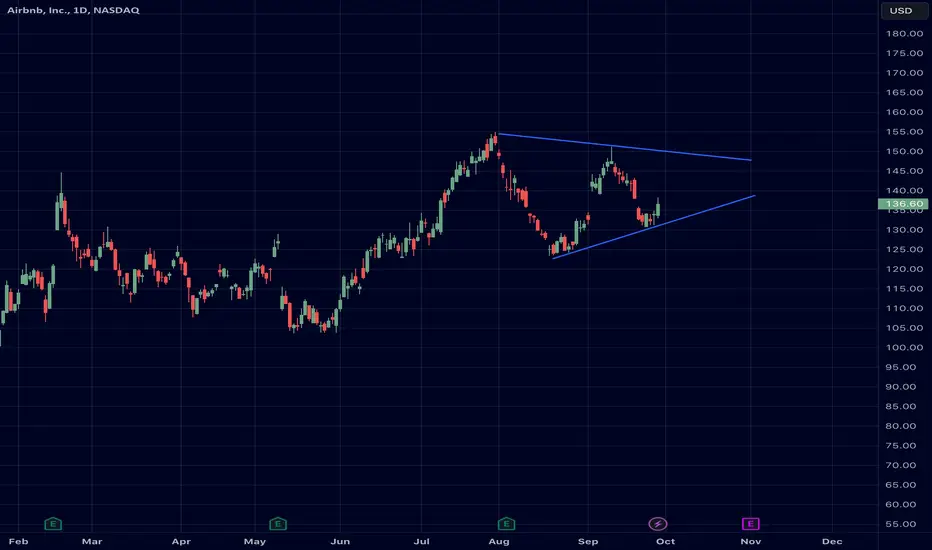
Pennant for Airbnb?!Price for the stock ABNB has found itself in a Pennant Pattern!!
On the second touch of the Falling Resistance, price was terminated in my Fib'd Kill Zone which has currently brought Price down to the Rising Support AND the 200 EMA.
-This touch will be the 3rd test of the Trend-line!
Now price still has Pinch Room to play in this pattern and Pennant Patterns can break Bullish OR Bearish so we need to be mindful of Price movements at the perimeters of the pattern!
On the Chart I have 3 possible outcomes:
1) If Price were to break bearish now, we could potentially see it test the Previous Low or the Break of pattern and bottom-side of the 200 EMA to continue lower in which case creates a "M" or Double Top Pattern
2) Price continues to Fill the Gap (Consolidate) until it builds up enough pressure to break Bullish and use the Break of Pattern or Fib Levels as a retest area to continue Higher
-OR-
3) Consolidates until enough Selling pressure enters and breaks Bearish and uses Break of Pattern or Fib Levels as a retest area to continue Lower
-Chart Patterns are known to fail 1/3 of the time!
-BEWARE OF FALSE BREAKS!

inverted head and shoulders abnblooking for a break out inverted head and shoulders play this could be a good longterm gainsssss

Aribnb Inc Analysis WeeklyAirbnb, Inc.is an American San Francisco-based company operating an online marketplace for short- and long-term homestays and experiences. The company acts as a broker and charges a commission from each booking. The company was founded in 2008 by Brian Chesky, Nathan Blecharczyk, and Joe Gebbia. Airbnb is a shortened version of its original name, The company is credited with revolutionizing the tourism industry, while also having been the subject of intense criticism by residents of tourism hotspot cities like Barcelona and Venice for enabling an unaffordable increase in home rents, and for a lack of regulation

AIRBNB Price ActionUpdate:
Harmonic Pattern and ABC Leg is forming on the current Price chart. Entry points, stop loss and targets are marked on the chart. Its to note that it is purely my POV and not a financial advise.

$ABNB: Top of the range?ABNB may attempt to reach the other side of it's consolidating range here soon or at least a marginal bounce. We'll see if the market allows for anything more than that but right now just expecting a short term move
Possible H&S on $ABNB dailyThe Head and shoulders pattern is considered one of the most reliable trend reversal patterns.
Previous idea 2022:
With chart

$207.5 target w/ close above $121.80, C Wave Bull Flag Set Up The AD is showing a bullish divergence on the Daily Chart, However on the weekly chart you'll notice a Bull Flag Set Up w/ a bullish Elliot Wave Count. Currently I have a C wave buy set up, but for less seasoned traders I highly recommend buying the confirm breakout.
Somethings to point out
1) you'll notice the 5th wave was rejected by the B leg of the bullish cypher pattern
2) B leg of the ABC pattern was also rejected by the B leg of the Bullish cypher pattern
3) Its important that these levels be flipped from resistances to support w/ a bullish close over both
4) I have 2 targets min. Target 207.50-$210 C leg retrace of the bullish cypher, and a Max $220 which is a X leg retrace of the bullish cypher pattern

Call Credit Spread Trade Idea, 10/20 ExpirationCall Credit Spread:
Buy ABNB $150 Call 10/20
Sell ABNB $148 Call 10/20
Approx credit: $75
Max Loss: $125
risk:reward 1.6:1

ABC/DThis pattern often reverses when the target, D, is met
Stop below C but since I missed this and it a ways from C ); possible stop around gap or where you see support.
Oversold with RSI on 70. Mine is on 80.
No recommendation.


airbnb is a good opportunity to buyHello, according to my analysis of airbnb stock, there is a great investment opportunity. The stock looks positive with the side channel broken. And the resistance at 130 was broken there. We also notice the strong green candle that formed on the daily time frame. It indicates a strong entry of buyers into the market. Finally, good luck to everyone

ABNB BUSTNow before you panic about what I am about to share, I want to say that I truly believe in Airbnb as a company. I personally own and operate Airbnbs and see the potential behind this company.
However, I do not like what I am seeing on these charts at the moment. I would not be surprised if this stock corrects if this wedge formation is broken.
We may first see one last impulse wave upwards towards the top of the wedge before falling. Key levels to watch will be a sharp corrective wave down below the trendlines. Weekly levels have been marked below.
Only time will tell.

$ABNBNASDAQ:ABNB
Inverse head and shoulders pattern and retasted, I think its ready top pump
Entry Zone: 132 - 135
SL: 123 (4H close)
TP1 145
TP2 154
TP3 163
TP4 185
NFA


ABNB looking to reverse a retracement LONGI look to see if ABNB will bounce from a 0.5 Fib Level and continue a trend up. This is shown
on a reliable daily time frame chart showing an unusual reaction to decent earnings. I will
watch for support and then reversal on that fib level. I will go down to 30-60 minutes to
find the entry. The chart has the death cross MAs and a confluence of the long MA with
the fib levels.

A Potential SupportAirbnb is another company I love. Beating earnings since Q2 2021. Strong fundamentals.
Today NASDAQ:ABNB touched the daily 100 EMA, around 4% above the 200 daily EMA, and below the 20 and 50 EMAs.
The stock went below the 100 EMA during the day and went all the way up with a nice recovery above it, holding the support around $128.
That's when I entered my position at $129.15. Stop loss at $125.80, looking for an 8% upside at $140.36.

ABNB - BEARISH SCENARIOThe correction for ABNB is more likely to continue. The first support is located at the $118 price level. If the support resists the pressure we may witness an uptrend to the $160 resistance.
Risk Disclosure: Trading Foreign Exchange (Forex) and Contracts of Difference (CFD's) carries a high level of risk. By registering and signing up, any client affirms their understanding of their own personal accountability for all transactions performed within their account and recognizes the risks associated with trading on such markets and on such sites. Furthermore, one understands that the company carries zero influence over transactions, markets, and trading signals, therefore, cannot be held liable nor guarantee any profits or losses.

Airbnb: Almost there 🌴The Airbnb share price is heading increasingly toward our magenta target zone with its magenta wave (ii). After reaching it, we expect a far-reaching rise in the magenta wave (iii), which will extend to around 200. Necessary for our primary scenario here is that the price stays within the support at $103.55. When crossing, the alternative would activate, which we assign a probability of 20%, and the price would have to target the turquoise target zone before a rise
