0A92 trade ideas

NNDM - Trend line bounce - Continuing Bullish PatternBullish trendline continuation.
It appears to have completed its correction and is now going to continue the uptrend.
If we get a daily close below $5.00 soon or a lot of sideways movement over the next few weeks, I will re-assess my long position.


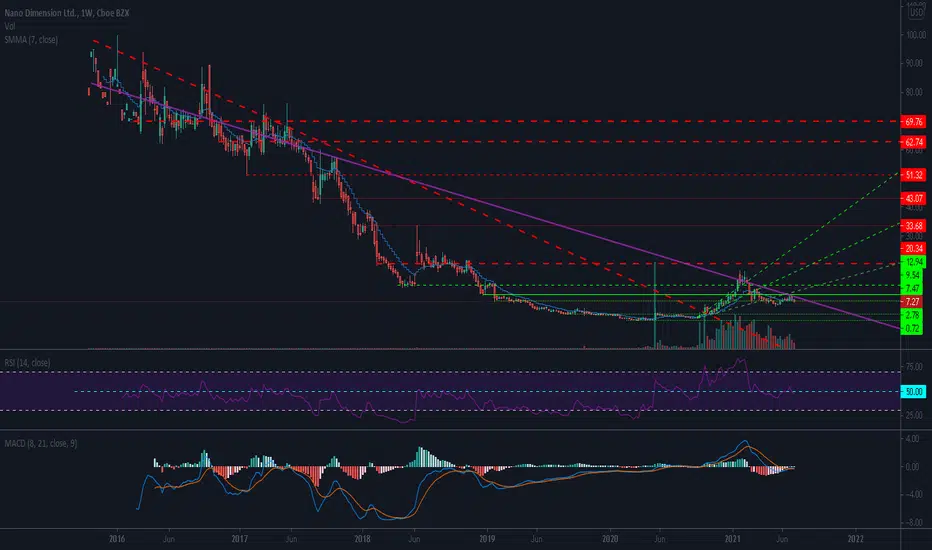
NNDM close to massive rally round 2?The main focus is on breaking through the purple line. It will happen. When it does, could be another massive rally. As you can see, when it broke the red sloping line it broke out. That sloping line had far less strength than this one does. Could be heading to $40 or $50... maybe even higher from FOMO.
NNDM broke out of the falling wedge patternNASDAQ:NNDM broke out of the falling wedge pattern. Any pullback is considered a buying opportunity, anticipated price action and targets are shown on the chart, stop daily close below 200 MA.
Hit the like button and follow if you find this useful :)
This is only my own view and not financial advice, do your own analysis before buying or selling
Happy Trading!

NNDM - 21 USD soon?NNDM shows a clear structure. The chart looks bullish! It is important to stay above 5.39. Otherwise my setup would be invalid. The following levels are important: 8.06 - 8.78 & the intermediate high around 9.32. Then we can look forward with confidence. Overall, I expect prices above 13 USD this year. In the long run, I have price targets of at least $21.

Reversal turning into Inverse Head and ShouldersLooks like a nice reversal after a higher high. Retracement is about 50% of previous move.
If it continues up, They'll be an inverse Head and Shoulders with a upward slopping neckline around $8.21.
Since the last swing high is about equal to the previous swing high, I'm out before $9.
I also think that $5.50 is the bottom so I sold a PUT at $5.00 Aug 20 for $0.15. That's a nice conservative play I think.
Disclaimer: I'm no expert, this isn't advice. I also own a fair number of shares of NNDM long term.
Comments welcome, especially if you disagree.

$NNDM Time To Be Scared?Nano dimension has had a hell of a run since May 12/13, but now the market can't decide what to do. Theres one side that main stream believes, which is inflation and the upcoming collapse of the market or the side of Cathie Woods which we will experience deflation. How can that be with money printing from 2020? Well we aren't printing money as fast now in the United States since the economy is reopening. IMO the money printing was unneeded to the degree it went, but now it has slowed down the market goes higher? One explanation is that the big money left in 2020 and the gov is the one who recovered the market with retail and now the big money is getting in at highs and complaining on mainstream media. This is just an idea and not proven fact.
We are here however to talk about NNDM, which has had a rise of 65% from May 12th/13th while bitcoin has fallen as low as 46% from that date. Correlated? No telling, but in Coinbases COIN er institutions controlled 60% of the volume in Crypto, so who knows. At the same time we talked about valuations of NNDM at $5 didn't make any sense, so was a recovery of oversold stocks? No telling, but the future does look bright with recent news in NNDM despite NNDM dumping at $9 as the NASDAQ continues to rally, so should you buy?
News
-CEO increases his position and owns 12% of the company. This is bullish facevalue, but the only downside he will have a strong weight in the voting. Many people are scared of more shares being sold, but thats unlikely, so this news is bullish.
-NNDM joins the 3dprinting etf. This might not mean much, but looking at the etf since 2020 it has increased from the lows of 2020 by over 300% and passed prepandmic lows.
-EX amazon employee becomes president of the america business side of NNDM. With recent news on Amazon and its continue growth. An EX high up employee joining NNDM is amazing long term and shows that NNDM is serious on its growth with their 1.4bil in cash.
-Upcoming news is 4 acquisitions, which two will make the business profitable so its a matter of time.
TA
-RSI is over sold which is bullish in the short term, but resistance is at 47.77
-MACD looks like a reversal is going to go green unless the shorts are going to take it down.
-We are range bound between 7.31ish to 8.09, which was a range we had before we broke out and head towards to $9
-We are in the low range of high vpvr levels, with 7.69 would be a short term resistance till we go test the $8 again
-A 70% correction from the recent high of $9ish is at $6.60
Final Thoughts
I hold my position and bought more at 8.20ish and I am up still, but not much. If you are up you can nibble or wait till 7.30ish, but its a high risk with the recent bullish news and growth the Nasdaq. Overall I think this selling is overblown and will remain long at these levels.


CorrectionIf the current support at 7.71 breaks the next support is at 7.33.
depending on where the corrective wave A ends the waves B and C could differ.
I think the chart is self-explanatory.
This is not a suggestion or advice.
Trade at your own risk.
NASDAQ:NNDM

As requested, what I think about NNDM! 👀As @rktraders requested, here are my insights about NNDM!
The 8.15 is an important support to watch. It is still in a bear trend, and there are nothing saying it’ll reverse, for now, but if it breaks the 8.15, it might just drop more, maybe to the 7.40, so be aware of this point.
Another thing that tells me that the area surrounding the 8.15 is important is the 4h chart.
We are just above the 20ma, after a pullback from the 9.29 (almost 9.32, the previous support), and we are above the 8.18, one of the previous tops.
NNDM is doing a lot of precise movements, following the TA principles pretty well. Now is the time for a reaction on the stock, otherwise, it’ll just keep dropping. At the first green candle you see in the 4h chart, it’ll be a buy, in my view.
If you liked this trading idea, remember to click on the “Follow” button to get more trading ideas like this, and if you agree with me, click on the “Agree” button 😉.


$NNDM Target $18See chart for details,
you can use the 100ema as stop loss depending on your risk tolerance


NNDM potencial 10-30% gainsFirst TP is about 9,75. At the first stage it could hit 10$. We could see a rejection from the first TP till 9$. afterwards it could continue its rise to the second TP 11.5-11,70. At this level its definitely selling worth. I am owning this stock since 7,26$.


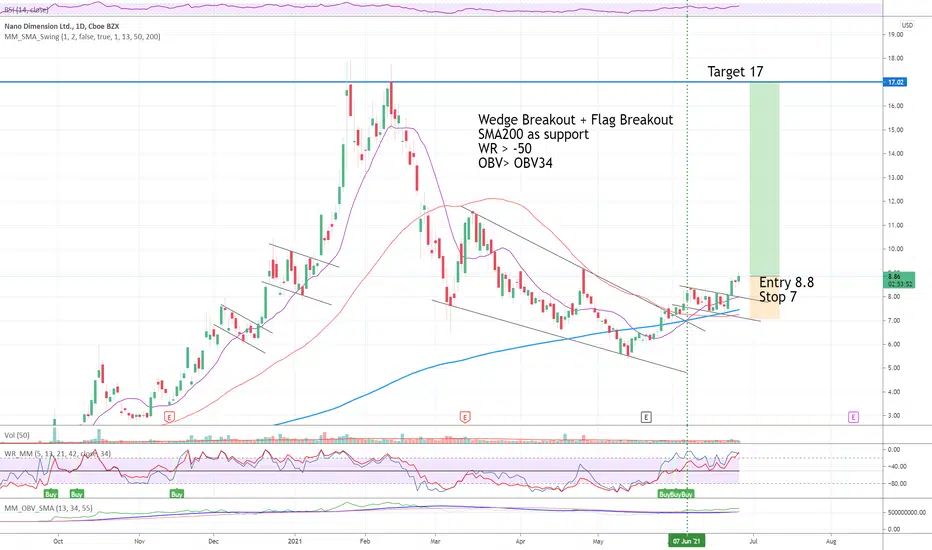
NNDM LongWedge Breakout + Flag Breakout
SMA200 as support
WR > -50
OBV> OBV34
Entry 8.8
Stop 7
Target 17
Risk management is much more important than a good entry point.
The max Risk of each plan should be less than 1% of an account.
I am not a PRO trader. I trade option to test my trading plan with small cost.
I created some tradingview scripts to improve my trading entries:
OBV and OBV SMA comparison;
Williams %R two lines;
Nano Dimension - 3D Printing - Heavy Call VolumeUsing YF as my source I note there's substantial volume in the $10 16-July Calls Options (19k, with open interest at 39k). Now trading at 50c (bid: 49c/ask: 50c)
Contract: NNDM210716C00010000
The technical are also shaping up:
MACD back above the centre line
RSI in a bullish regime
Stock at a 2-month high, having regained the 50-day EMA
Also, holding above 'resistance level 1'.
Spot: $8.83
Nano Dimension Ltd. is a 3D printing company. The Company focuses on the research and development of 3D printed electronics that includes a printer for multilayer printed circuit boards, and the development of nanotechnology based inks.

NNDM - FIRST TARGET CHECKJust charts
Last update:
"Next big target 11.80 - 12.14. That depends on whether wave 2 has already reached the low. Basically there is the possibility that wave 2 can correct wave 1 up to 99.9%. A logical target is 38.20 - 61.8%. We have already achieved 38.2%, so we have the possibility of reaching prices around 12 in the next few months. This theory would be confirmed if the price found support at 8.15. The 78.6 fibo level serves as a reversal signal and start signal for wave 3. We are currently at this point. If the price rejects there, it is possible that wave 2 will reach another low. So be prepared that we can see prices at 7.27, 6.91, 6.56 or 6. 05 again."

NNDM - current situation Next big target 11.80 - 12.14. That depends on whether wave 2 has already reached the low. Basically there is the possibility that wave 2 can correct wave 1 up to 99.9%. A logical target is 38.20 - 61.8%. We have already achieved 38.2%, so we have the possibility of reaching prices around 12 in the next few months. This theory would be confirmed if the price found support at 8.15. The 78.6 fibo level serves as a reversal signal and start signal for wave 3. We are currently at this point. If the price rejects there, it is possible that wave 2 will reach another low. So be prepared that we can see prices at 7.27, 6.91, 6.56 or 6.05 again.


Nano DimensionStrategy/Chart pattern: Break out / Bull flag
Entry: Immediately
Stop: 7.21$
Target: 10.24$
Risk/Reward-Ratio: 1.5:1
Stopmanagement: Parabolic SAR daily chart default settings
Intermarketanalysis: Please are beware of the fact that the probability of rising yields of the bonds in the next weeks to months is much higher than their decline which again is bad for techcompanies with a high amount of outside capital. This is why I would recommend to only risk 0.3% of the portfolio
