0H6E trade ideas
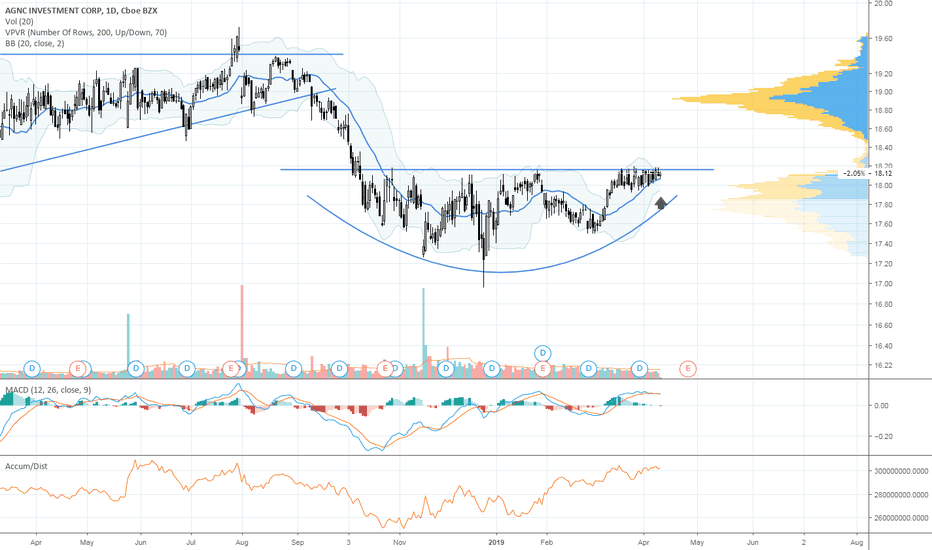
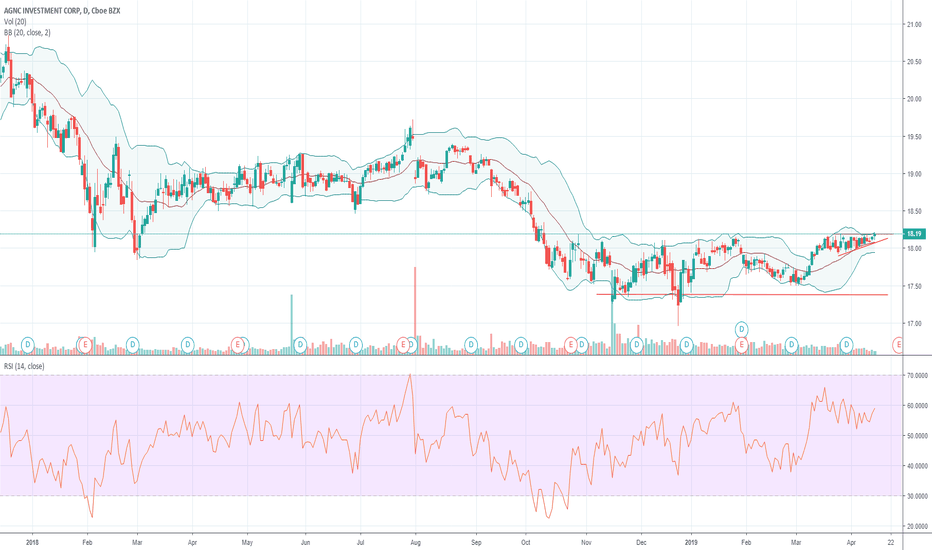
$agnc on it's way to ~13% gains.$agnc is on its way to squeeze, and anyway you look at this, is closer to breaking the upper line and move up, then drop down. It's been bouncing between the 10day and 50day ema for almost a month, and once it breaks it, we'll be looking at a decent move. This stock also yields decent dividends so it's a solid hold as well.
13% gets us to previous resistance at ~14.40.
AGNC for 480% gains in just 6 weeks!I posted about AGNC at the beginning of January when AGNC was around $17.50, I called for $20 no later than June. What a pleasant surprise that AGNC has continued to stay on fire!
Now one might ask how did I turn this little, fairly slow moving stock into 480% gains in just 6 weeks? I mean this sounds like crypto gains, not stock market gains! This is a strategy I like to use where as I find a stock I expect to move but specifically a stock that typically doesn’t move that much. What we find is that the options have almost no overhead premium priced in and are super cheap. Here I bought 50 call contracts for June expiry @ $18 for .28cents each. I am now $1.50 in the money and just continue climbing with a current option price of $1.60!
Here is a capture of my specific options and their gains to date. > imgur.com
AGNC had another surprise earnings marking two in a row now, an indication that in fact fed policies are benefiting them more than anticipated. AGNC also announced an offering but #1 it was priced at $25 and #2 their offerings aren’t really dilutions, its just an expansion of capital that is tied 1 to 1 with real estate backed securities, more akin to expanding their balance sheets.
I took this opportunity to update AGNC because due to the incline, it looks like we will see a $20.50 top of channel and by next month at this rate. This is in contrast to $20 top of channel on this descending channel in June. Also I am selling most of my options now to buy more options further out of the money. While I suspect we will see decent resistance @ $20.50 I believe everything is in place to break resistance this time and start heading back up, maybe $24ish by late 2020.
If you have never traded options, you should be extremely careful. Options can expire worthless turning your entire investment to $0 with zero holdings. I prefer option trading to margin trading for leverage trading as I am only risking what I put on the table, I know my total risk up front. Options are not for the faint of heart or new investor.
This is not investment advice, DYOR, if its something new to you, always start super small while you test and get a feel for how it works.
I will post another update on AGNC as we see the channel resistance start to flesh out.
If you trade Crypto as well, please check out our site vcdepth.io with advanced real time and historical level2 data for the broad crypto market.
Good luck with your trades!
AGNC to $20 second quarter 2020AGNC has a great Dividend at around 10%, used to be 20% though when money was near free as they make their money on (long-term/short-term) credit swaps. Loose monetary policy fed AGNC coffers and loose monetary policy has been returning. After seeing 3 rounds of QE along with 3 rate cuts in 2019 and a presidential push for negative interest rates from the feds, there is a lot of room not only for AGNC to return to 20% dividends but also see quite a bit of price growth.
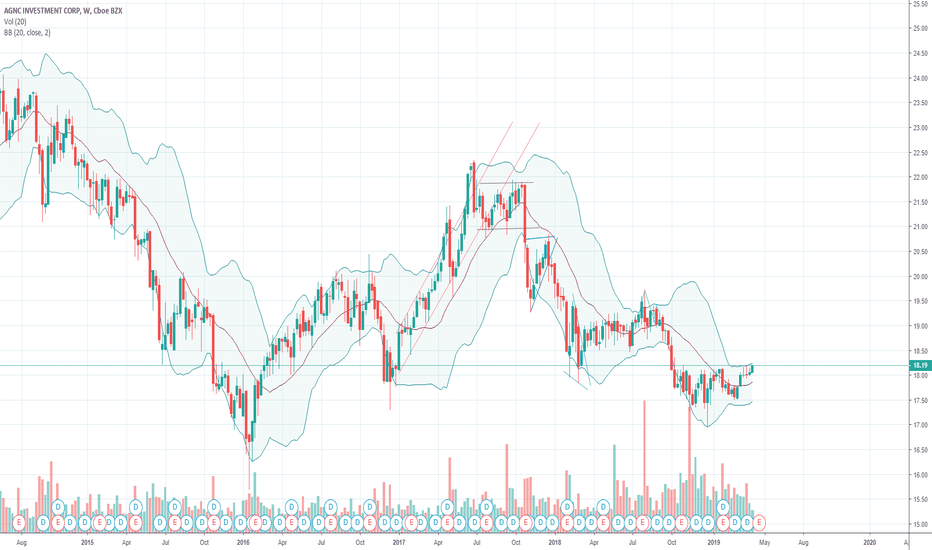
To be fair, AGNC has been in a massive descending channel since 2012 and overall the trend is bearish on the charts and we are currently mid channel. It is because of the information above that I suspect AGNC may break out of this multi-year descending channel in 2020. Even without breaking out of channel, just remaining within the constructs of the current trend, AGNC should see a little over $20 by mid 2020 along with increased distributions.
There is always the chance that we see another real-estate market crash and AGNC's books will be full of junk but absent that, this is a great play for 10% gains and 5% dividends over the next 6 months and with a break out of channel and reversal of trend, this could be a great multi-year hold. I am holding AGNC long, I have held them off and on for many years. This is not investment advice, just some observations I have made in my evaluation. DYOR, invest with care.
S
AGNC: Sort opportunityAn intraday high potential, Back Tested Sort Analysis.
We ll try to enter into the correction of the uptrend movement.
DETAILS ON THE CHART
NOTE: Entry range area above the entry point, is calculated upon 80% of the recorded pullback back tested past performances
DISCLAIMER: This is a technical analysis study, not an advice or recommendation to invest money on.
AGNC going up or down?I have a down trending slope that has bullish context(resistance becoming support) and an up trending slope with bearish context(support becoming resistance)
I am waiting to see which slope is in control. I am short term bearish as we are still under the neckline of the H&S pattern but long term bullish as MACD has bullish divergence as price has declined. See my other post.
For me to become fully bullish, I would first need to see price take out the neckline of the H&S and would prefer to see the same line act as support then second I would need to see the top of the downtrending slope be taken out by price. For now, I am playing the waiting game.
AGNC going up or down?This chart only shows price and some channels/slopes.
We have both a down trending slope with bullish context as resistance has now become support but also have an up trending slope with bearish context as support is now resistance. I have highlighted the lines I am watching in green. I am just waiting to see which slope shows me that it is in control. I am short term bearish as there is a H&S pattern that has broke and still under the neckline but long term bullish as MACD is showing bullish divergence as price has declined.
See my other post on AGNC regarding the MACD divergence.
Go Long AGNC?As you can see we have bullish divergence in the MACD. The two previous times this happened, AGNC had nice rallies from their lows. Note also how present price action could also be forming a H&S pattern that has broke the neckline and appears price could be forming a hand suggesting lower prices are to come. IF lower prices do follow and MACD makes again another higher low, this could be a signal AGNC could come back up.
AGNC Bullish AB=CD & Bullish CrabAGNC is showing a large AB=CD pattern with an internal Crab pattern. Both patterns complete in the same price zone along with bullish divergence from the volume weighted MACD, so momentum is starting to swing up.
AB=CD Measurments
- .618 / 1.618
Crab Measurments
- 1.618XA
- 3.618BC
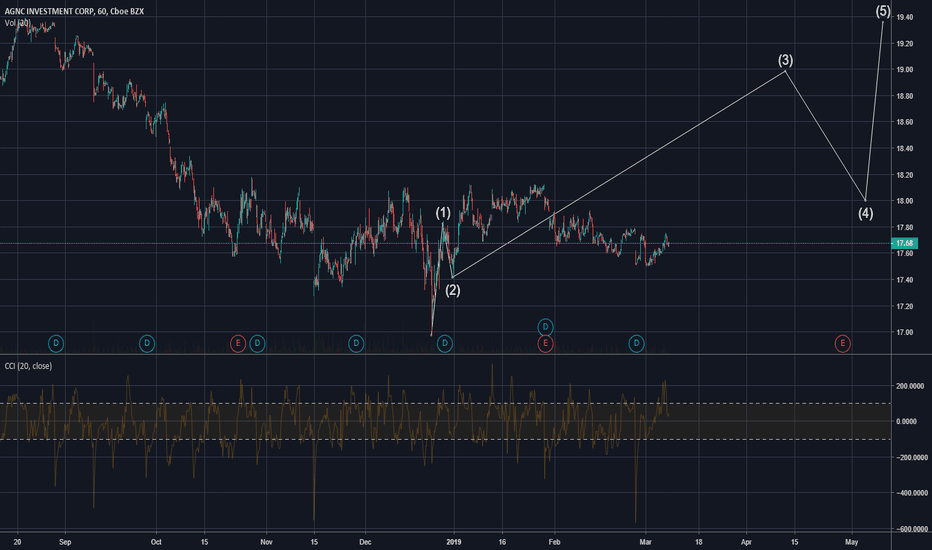
AGNC - WAVE ANALYSIS - 12 MONTH PROJECTIONSTRONG BUY - AGNC - AMERICAN CAPITAL AGENCY CORP - NASDAQ
AFTER A BIG DOWNTREND WE NOW LOOK TO BE BACK ON THE UP AND AT THE END OF WAVE 1 WHICH IS A NICE RISING WEDGE LOOKING TO BREAK DOWNWARDS THAT SHOULD GIVE US WAVE TWO (PLEASE SEE LINKED CHARTS FOR THE CURRENT BREAKOUT) ONCE COMPLETE WILL BE MOVING ON TO WAVE 3 WHICH SHOULD BE A NICE STEADY UPTREND WITH 12 MONTH PROJECTIONS REACHING MAXIMUM OF AROUND THE $23 AREA
AGNC - RISING WEDGE BREAKOUT PLEASE SEE LINKED CHART FOR FULL ANALYSIS - WE ARE CURRENTLY IN WAVE 1 OF UPTREND AND LOOKING TO BREAKDOWN TO GIVE US WAVE 2. WE DO HAVE A 1-5 COUNT WITHIN THE WEDGE AND ABC CORRECTION SO IF IT DOES BREAK WE COULD GET IN FOR THE SHORT. LOOKS LIKE WE SHOULD OF COME A BIT FURTHER UP BEFORE THE BREAK THOUGH SO THERE IS POSSIBILITY WE MIGHT COME BACK UP THEN DOWN BEFORE BREAKING OUT


