Crossover MACD and turning oscillators 175 pathWith meaningful data and the composition of selling off aggressively in previous sessions, the bullish era of sentiment is well within the palm of our hands. The only aspect of it being dragged constantly might be the moving averages turning 100 to the death cross, but that is a milestone away from the current potential.
0HAQ trade ideas

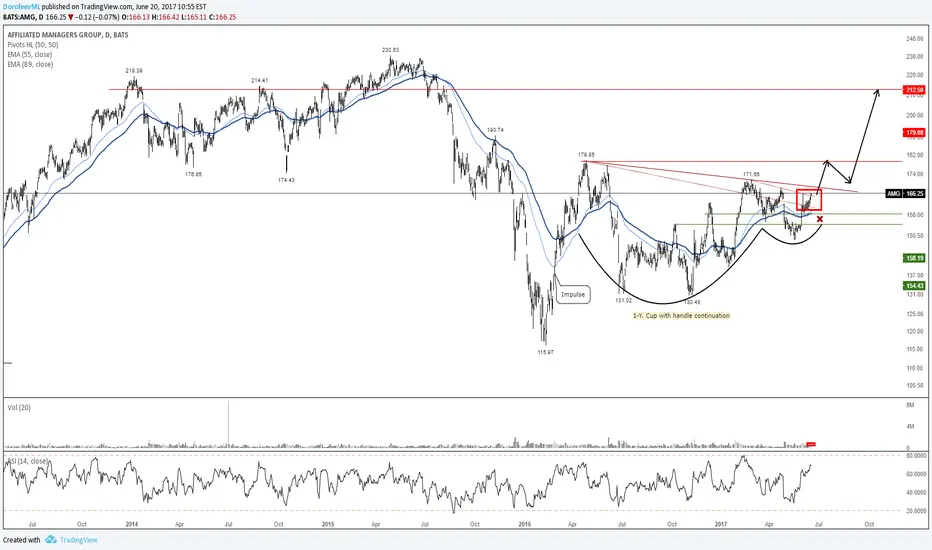
AMG Dont miss this one!NYSE:AMG Has formed a bullish impulse with a healthy correction and a lower degree impulse with a lower degree correction that is breaking out of the larger degree trend line!
This is great confirmation of a trend continuation setup.

AMG - Large Inverted H&S Within ChannelAn inverted H&S pattern
We are now experiencing the right shoulder which is a bullish phase
Shown the bullishness with the bars pattern tool

AMG - MegaphoneLarge megaphone structure
Price is positioned at the lower area of the megaphone which suggests that a move upwards may be in order
This bullish assumption is emphasised by the double bottom in white

AMG ABC/DEABC/ABC
ABC/DE
A 7.8M
B 6.7M
C (A) 11M
D (B) 3.1M
E (C) 8.2M
31thDec 1.8M... Target Hit the 191!
Elliott Wave Theory, or ABC wave theory, is a term for three-wave counter trend price movement. Here, wave A is the first price wave that is against the trend of the entire market. B wave is a corrective wave for wave A. Wave C shows the final price move to complete the counter trend price move.

Tested the support lineFast check-in, maybe too fast, may need to test again.
Meantime nice engulfing

AMG I think its going to break downWe should know this week where shes heading, I think its going to breakdown but Im going to wait a bit longer before make my position.

Insider buying in AMG signals undervalue and confidence From a technical perspective the chart is looking like a possible reversal is on the way, after suffering a 50% downside drop, it would come as a welcome relief for investors. The recent insider buying may be the catalysts for such a move as the put their money on the line and see value at the current price level.
AVERAGE ANALYSTS PRICE TARGET $112
AVERAGE ANALYSTS RECOMMENDATION OVERWEIGHT
COMPANY PROFILE
Affiliated Managers Group, Inc. is an asset management company with equity investments in a diverse group of growing, boutique investment management firms. The firm provides assistance to investment management firms in strategic matters, marketing, distribution, product development and operations. The company was founded by William J. Nutt in December 1993 and is headquartered in West Palm Beach, FL.

$AMG BUYERS ARE BACKAffiliated Managers Group has hopefully completed a 4 year long correction, It has not been rewarding to its long term holders but there is signs of life once again. Buy volume and technical indicator point towards further gains and this stock could easily double.

Affiliated Managers Group, Inc.DAILY
on a sideways
consolidation
breakout point at 112.23
initial support at 103.08


#AMG #stock #shortAMG has formed an H&S on the daily with indicators pointing down. Expect about a 2.5 RRR

Classic 4x4 Retracement Setup on AMG After setting a new monthly high close of $200.43 on December 8th (note the negative divergence on the 10-day RSI), AMG put in four lower closes, setting up a potential "4x4 Retracement" signal on Friday, December 15th. AMG did not disappoint, closing up 2.3% on 2x average volume on Friday - signalling a trade entry for Monday.


$AMG WeeklyTrying a new strategy with the MACD. Note the Lines I drew on the MACD. Watching reaction after it breaks that second black line on the MACD.

$AMG on the WeeklyWatch the two green Lines on the RSI! If it breaks that top green line=====> BUY BUY BUY imo.
Please provide thoughts and feed back if you have any! Thanks guys!
-Quick note: anyone have any thoughts on my trend lines for the chart itself????

$AMG Monthly Chart SetupWait for price action to break the green resistance line before entry. Rsi needs to break above ~61.9, look at the red line on the RSI.
Consolidation around the area it is at right now seems to be around a Fibonacci level if we look at the last major run. Sorry I do not know how to draw Fib retracements on chart otherwise I would.
Would like to see uniform(symmetrical action) on the MACD. If we see uniform action on the MACD with it crossing above zero and RSI above 69.1 I will make an entry.
If you any any comments please make them!!!!!!!! Help me/us learn. All feedback is welcome. Thanks guys.
If you need any clarifications on the chart please ask! Help your self learn!

AMG: Update of visionSignals
double bottom
potential flag
Buy 145.00
Stop 139.44
Target 1-160.00; 2-180.00

$AMG descending broadening wedge on 60$AMG
Descending broadening wedge on 60. Pos divergence on RSI.
Looking for a move higher.

AMG TRADING OPPORTUNITYThere are 3 strong longing signals gor entering the position:
1- double bottom (confirmed by the brealout of neck)
2-pennant with oncoming breakout
3-volumes during formation of double bottom support the idea of trend reversal.
Buy 147.40-148.00 (the breakout of pennant's resistance level)
Stop-loss 137.00 (7% of allowed risk; if it's possible move stop-loss to 131.00 (-2 tics under double bottom)
The first target 160.00
The second target 180.00 (according to levels of resistance and Elliot's waves.)


AMG1. Buy call when higher closed price yesterday.
2. Exit 1 target 163.5 when meet the resistant line.
Exit 2 target 165.83 when closed gap.
3. Stop when under 157.3 (159.08-1.76); (163.5-159.08=4.42= 2.5R; R=1.76)
