0HCB trade ideas


alcoa long - up trend continue - (trends and support)doing a alcoa long - target around 56!!!!
let's go!!!
!!be aware trading on this moment is really risky!!

ALCOA is at a historic risk/reward ration.The company is at a level not seen since the 2008 crisis. Wonderful level considering the positive economic changes we have lived ever since.
I would stop myself if price drops under $34.80 just to give my trade a change to breathe, but if you are thinking of holding it longer, I would advise you to stop yourself around mid-20's and have a higher TP.

AA scale into this. I will begin gambling here tomorrowSo check this, my goal is to buy low.... and.... SELL HIGH!


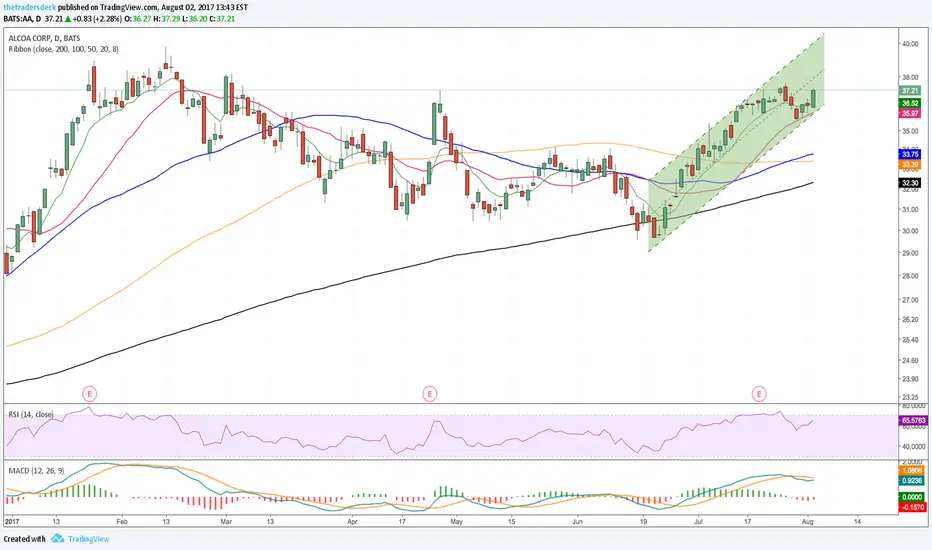
Alcoa completed important pullbackThis is a classic example of a horizontal resistance that becomes a support after a breakout. Alcoa successfully completed a pullback tot the former resistance which has become a significant support now.
In addition we can draw a upward trendline (support) under two bottoms. This upward trendline can act as support(stoploss) for the uptrend (long positions).
Current RSI level is historically high so we might see a cool-off period after which Alcoa will probably continue its uptrend.

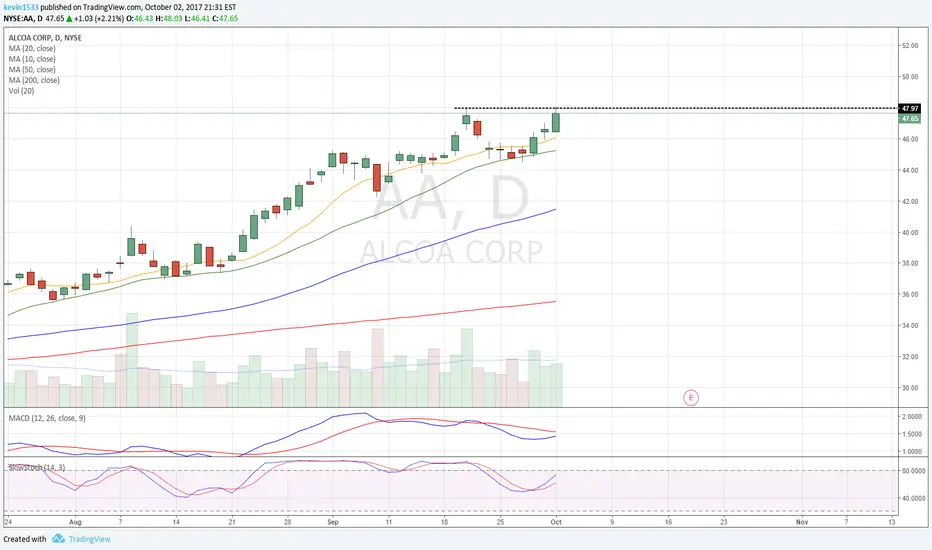
AA - great risk/rewardAA is trending up
stock broke above 40$ which acted as resistance
last week price retested the area successfully, creating a hammer candlestick in the process
nice risk reward here to retest the highs and close to support

AA According to technical analysis stock picking,AA According to technical analysis stock picking, week macd Jin Cha, and heavy volume, so buy on the approach

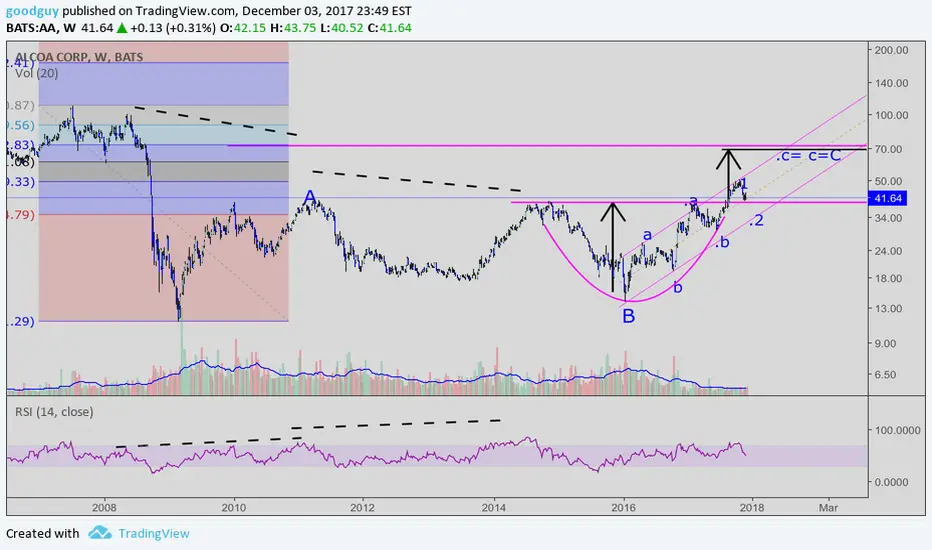
Alcoa AA: Profitable correction?Recent breakout of cup formation with retesting breakout line. Could still short term go back to up channel line but longer term think likely will up wave to about 70 which would be .62 correction
If you like fundamentals see: seekingalpha.com
Interesting to me is the 2 negative reversals in the RSI (dashed black lines) both of which led to a negative trend change. The first was aborted by a bullish divergence. Currently have a potential bearish divergence.
AA breakout long setup 3 win to 2 lost ratioIt is a decent trade with win side of 3 and lose side of 2.

AA - Stochastic Divergence on SupportAfter 8 years, AA broke through 40.00 resistance and is testing it as support. With the stochastic divergence signal, we should be able to hold and move higher.
Buy: 42.60
Target: 44.08 - 46.46 (3.46% - 9.06%)
jbzstocks.com
@jbzstocks

AA - Stochastic Divergence on Support LineAfter 8 years, AA broke through 40.00 resistance and is testing it as support. With the stochastic divergence signal, we should be able to hold and move higher.
Buy: 42.60
Target: 44.08 - 46.46 (3.46% - 9.06%)
jbzstocks.com
@jbzstocks

Alcoa - a clear buyAfter breaking the major resistance area around 40$, Alcoa viciously came back down for a test. I would buy against this major support, given the bullish hammers and the oversold Force Index.
Soft stop below resistance, around 36$. Target at 60$.

Resistance becomes Support (Weekly Chart)You do not need to draw many lines this here. Key points here
1. Resistance becomes Support
2. Breakout of the resistance line at 40.00 (Round number)
3. Pullback and a bull hammer candle
In today idea I do not want to write a complete book about this chart, because the chart speaks for itself. But there are a point here:
The PE Ratio is: 49.37 looks high for you? This is relative for some investors. There is no absolute truth about the PE Ratio or else no one would buy this action because the PE is High.
Material for learning:
www.investopedia.com
stockcharts.com
www.onlinetradingconcepts.com
www.rediff.com
www.investopedia.com
Opinions are for educational purposes. I am not licensed to provide investment advice

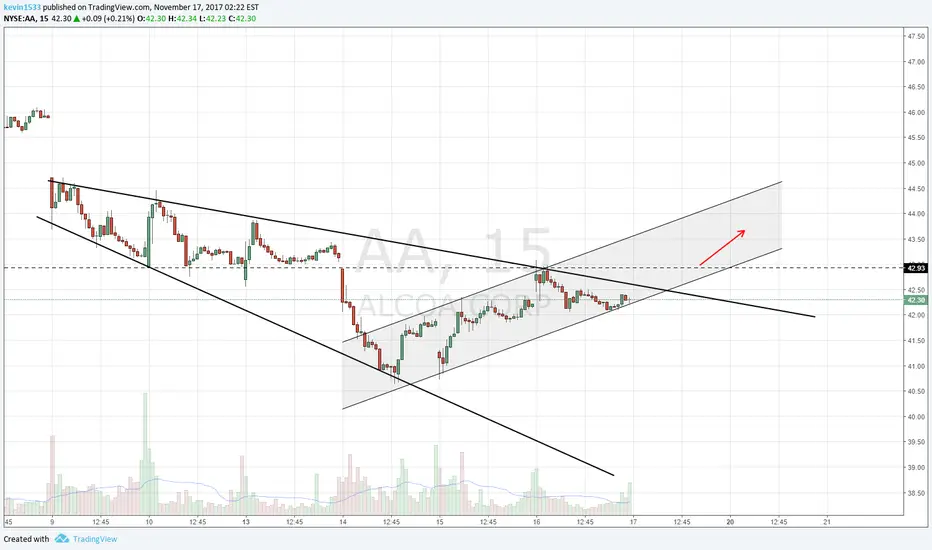
AA short!!if you joined me on my last SNAP trade join me here
broke trend and has been diverging
not to mention market is reaching a top
updates to come