0HCB trade ideas


TRADE IDEA: AA MAY 5TH 28/32/32/36 IRON FLYAA (implied volatility rank 73/implied volatility 48) announces earnings on Monday after market close, so look to put on a play before the end of the session to take advantage of the post-announcement volatility crush.
Metrics:
Max Profit: $210/contract
Max Loss/Buying Power Effect: $190/contract
Break Evens: 29.90/34.10
Theta: 4.96
Delta: 3.51
Notes: This is a preliminary setup that may require some tweaking once NY opens. As with all short straddles/iron flies, I would look to manage this at 25% max profit.
Currently, the setup is bid 1.75/mid 2.10/ask 2.45, which is not exactly "tight." Personally, I will look for a fill at or slightly above the mid price. The fly's an 8-wide, so I would have to get 1/4th the width of the wings out of it to make it worthwhile anyhow (i.e., >2.00).

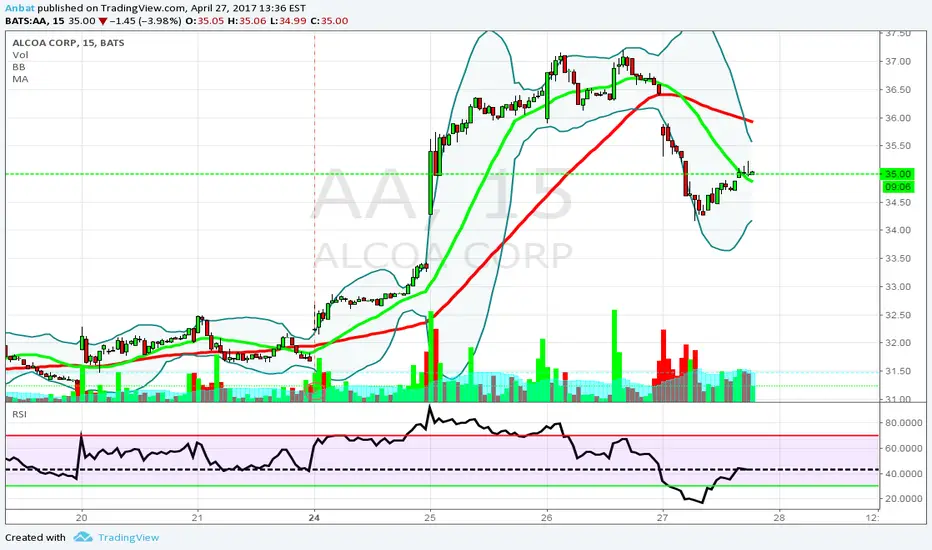
AA going downSee chart. RSI is preceeding price this time big time. Breached top of trading range. Breached trend line of strength. Heading for its 200 day MA, and then its bye bye aluminum. Why? Aluminum is in almost everything. Auto sales down (aluminum trick beds i.e. Ford) , auto loans in question, retail suffering, big plans are stalled, grid lock has locked up Washington's brakes. FED has gone public they are aware. And now we are going tell China to stick it, pay up, play fair, really, a little bit? Really? A reset is needed, and China is just the one to send a message that they hold the trump card in this game now. 70% of all clothing and shoes, and other stuff is all made in China. Companies have been profitable only because their cost of goods has been historically cheap. Retail will almost certainly just die, or become disabled. Amazon, costco, sams only games in town. Also for corps to be proftable, no growth in sales, but cut costs, more efficient (fire people, eliminate jobs, roles, install robots) parties over. How about a 10% drop, or more? AA is a very good barometer of our economy, which is about to tank. And AA to 22, it could happen. Might be just what is needed to release the grid lock, and put a little panic in their reelection campaigns. Maybe then they will go in a room and not come out until they have a deal done. Idiots! Do it now, and save us all some of this pain. Oh well.

AA - better some than none. Industry:
EPS due date: 4/10
Horizontal S&R: no
Channel S&R: yes
MA S&R: yes, 50ma
>200ma: yes
Volume confirmation: no
Candle Confirmation: no
Stoch Divergence: oversold
Reg Trendline >85: no
Short Float: large cap
Risk / Reward: 1.6
Any feedback is welcomed.
Seems like the best trades offer little chances to get in. I got in starter position on the 27 w/ hopes of adding. Looks like now about to hit target. . .


Alcoa consolidating at supportALCOA (AA) showing signs of consolidation at support. Look to enter long on break of upper consolidation line OR short on break of support line. Long position is more likely given recent price action.
LONG play (break of upper consolidation line):
- Enter stock at 36.39
- Look for exit below the 38.95 support line within three to four days.
- place stop loss in the consolidation area so you don't get wrecked by a false breakout.
SHORT play (break of support line):
- Enter stock at 35.96
- Exit stock above the next support level around approximately 32.66.
- Set stop loss at 36.00.


Alcoa Has All The Marks Of A Stock About To Dive To $32Something is amiss with aluminum producer Alcoa Corp and I will tell you exactly what it is. After reporting solid earnings at 52 week highs, Alcoa Corp opened higher and collapsed. The stock put in an ugly reversal which should scare any investor who is long the stock. Over the last few days, Alcoa has been unable to catch a bid. Instead wallowing sideways. The inability of it to surge higher and retest the recent highs give credence to analysts signaling caution. This stock chart pattern may be setting up to signal Alcoa is headed sharply lower. Perhaps as low as $32.00. Considering the current price is $36.45, it would be a dramatic fall. Stay tuned as there may be a short trade setup here.


AA Ascending trianglethe Ascending tiangle is a bullish chart pattern used in technical analysis that is easily recognizable by the distinct shape created by two trendlines. In an ascending triangle, one trendline is drawn horizontally at a level that has historically prevented the price from heading higher, while the second trendline connects a series of increasing troughs.
Traders enter into long positions when the price of the asset breaks above the top resistance. But in this case, we can see that the volume is dropping and the MACD is showing divergence. Therefore qe should wait for a candle of confirmation after the breakout before entering the trade.
-Bollinger bands are tightening


Trade Alert: $AA Likely To Hit Big Short Level At This Price... Shares of Alcoa (NYSE:AA) bounced higher last week even as the stock market and commodities dropped. Today they are surging again and likely going higher as the stock has yet to hit any major resistance. The resistance level is at $27.00. This is the point where I am going to pull the trigger on a short trade. The stock will have been up over five days straight and tag a major gap fill when it hits that price. it likely will happen this week. In technical analysis, gap fills are major resistance points when a stock rises into it. This would be the case with Alcoa. As I believe a post election rally is at hand, I will wait patiently for it to hit later this week. Stay tuned. It is a great stock trade setup.
Jenny


