0HCB trade ideas


Elite Zone pre-earnings setup exampleThis setup was one of several setups sent today to the Elite Zone members in the weekly members stock markets analysis.
If $AA will continue its climb (after a strong weekly candle from last week) and reach the resistance zone near 17$, it will also complete a bearish Bat pattern.
17$-17.5$ will be an interesting zone to look for intra-day reversals that can trigger short entry for those who wish to trade this bearish harmonic pattern.
If you like this analysis and you want more.. join the Elite Zone members via the MarketZone website:
www.themarketzone.net

AA, 1st to announce earningAlcoa will be first company to report earnings ushering into 2015.
Just my little speculations on where the direction of gap will be for better than expected or deteriorating earnings.

AA- The start of earning s season- Gap play possiblitiesGap Season is starting with AA posting earnings.Since AA has trade bullish the last 4 days a gap down below 14.85 would be a possible Gan n Go trade (enter the trade in the first few minutes of trading because of criteria met ). I would only trade in the direction of the gap , so if I didn't trade right away i would wait for a pullback and trade bearish (if i can get a decent R : R ) and only risk 1 R. If AA gaps down depending on the location (15.55) might be looking to get in bearish if there is a decent pullback or a perfect entry in the first few candles that it's worth the 1 R risk.
Last time AA posted earnings leading up to earnings 10-8 -14 look very similar to the candles leading up to the earning s tomorrow. AA gapped up and then traded down rather aggressively. We are at those same levels who knows?
There is a lot i didn't explain mostly because I'm not really the one to be teaching this type of trading but i would love any gap trading input especially fades.
If you want to learn more go to www.reallifetrading.com.

Only 3 days remain until US Earnings Season Begins! Alcoa reports on January 12th to kick off the next "Earnings Season"!
Get ready for action.
The red boxes represent the "DOWNSIDE" price action of the market from the start of the Earnings Reporting season as measured by Alcoa reporting earnings. You can see we have had a variety of quarters with some very small downside risk and the last two have been larger than average. I personally think this is a better or more intuitive barometer than the January effect or the first day of January predicting the year head.
I love January the most of all the months of trading for a number of reasons, perhaps you can say which is your favorite month to trade, then I'll explain why I love January the most.
All the best,
Tim 9:56AM EST Friday, January 9, 2015

Multiple Tops looking to break above 18DEC08:Multiple Tops at the 17.75 level, unable to break this historic level plus a weakening trend and a negative divergence make this stock to think it over before retrying the break above the 2011 levels.
It looks like this will take a break before attempting a close above 18 again. It has support at the 14 level.
I am bearish in the short term, looking for 15.30 looks a reasonable target to the downside and an opportunity for the stock to retry another upleg looking for the 18 value once it reaches the 0.764 Fib Level.
I wouldn't short it for too long since the main trend is bullish,

Alcoa Inc (H1)Alcoa Inc (H1)
Price hit long term uptrend_line from beneath, resistance and formed a triangle like formation, and broke down from it, and under Wedge, and long term horizontal line. (could be a pennant continuation-bullish, in case of recovery)
Wolfe Waves 5 potential.
OBV at horizontal resistance.
RSI geometry, brake_down from triangle like formation, on longer term support, at 44, potential bounce and brake_down.

Alcoa - Another green impulse tradeThe weekly chart of Alcoa does not look great for the long term, as it might draw a topping formation. However, for the next couple of weeks, it remains bullish
On the daily chart, we have green impulse, rejection of the wave, and a bullish engulfing candle. Not the best trade because this stock stands at an important level.
This is a paper trade.


$AA - shortAA has resistance in the $16-18 area. For candlesticks reader, there is a bearish hanging man formed. This is in a monthly chart - even more powerful.
Rising Wedge setupBearish setup in $AA as the stock struggles with resistance zone and the 78.6 Fib reversal level.
A potential rising wedge formed in the daily chart. Wedge breakdown could lead to a continuation move lower towards 15.6 (initial target level)


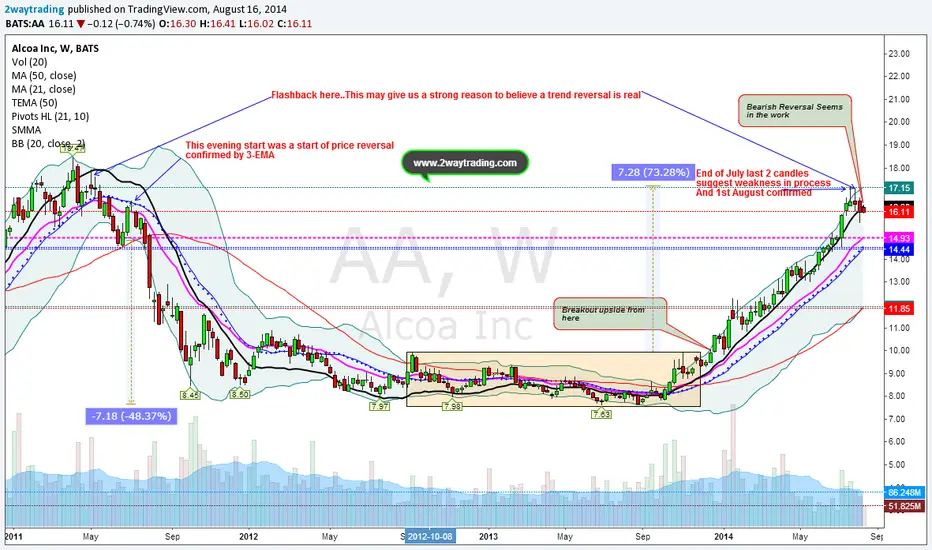
Follow up Post( Target achieved)Over 2 months ago, we posted a possible trend reversal and it indeed was, and target for that trade was achieved. Many asked for update if Friday's strong runaway gap up is a continuation of previous upside trend or was it a technical bounce. Hard to tell, but price action and volume was not two things to ignore. Here is what we had to say that post (Hard to detect early if trend specially strong one like AA is about to reverse, but our system signals that is the case for the stock. If you are long this stock, you may start the preparation to book profit before its too late. As u may see this weekly chart, there are some similarities of previous strong trend reversal and this one. If price moves below $16 next week, we will initiate a long term short position of 9-10 weeks. Target price: $14.40 area. Details see the chart.) if you want to a real time trade alerts try us (www.2waytrading.com)

AA Anonymous - Time to QuitAlcoa has become extended and been a great trade that I took part in from 2013, but I don't thin there is much upside left. Given the Fibonacci extensions and inability to break the 50dma after-hours given 3Q earnings I think we are simply seeing a re-test of a broken trend line and setting up for a move lower. I would not be surprised to see a "sell the news" scenario play out in the coming days.

Short AlcoaMetals & Mining have been underperforming the S&P since August as commodity markets sold off.
Alcoa has now entered a downtrend after reaching a double top at 2011 highs near 17 a share.
The Bearish divergence between price and MACD also suggests more downside in the new confirmed downtrend.
Initial target: 38.2% Fibo retracement at $14 a share


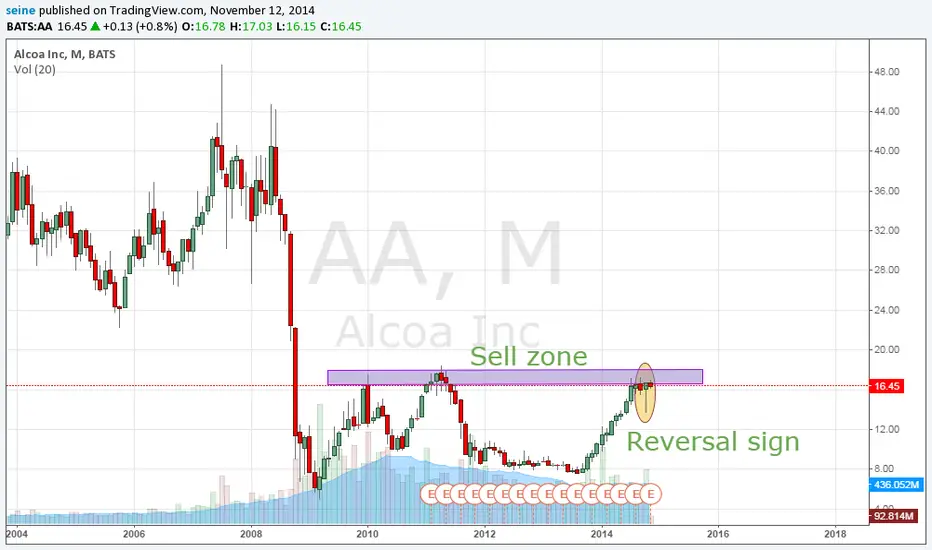
Alcoa's Stock May Soon See Trend Reversal Hard to detect early if trend specially strong one like AA is about to reverse, but our system signals that is the case for the stock. If you are long this stock, you may start the preparation to book profit before its too late. As u may see this weekly chart, there are some similarities of previous strong trend reversal and this one. If price moves below $16 next week, we will initiate a long term short position of 9-10 weeks. Target price: $14.40 area. Details see the chart.
Alcoa to kick off earnings Elliott wave forecastU.S. futures decline, Alcoa to kick off earnings; Dow Jones down 0.12%
ABC retracement elliott wave count pattern forecast + Gann+ Fibo
Bearish divergence
$12.5 target nov 2014

Alcoa Earning WorriesAlcoa has had a terrific 2014 but could this run be coming to an end, at least temporarily? With earnings in less than a couple of weeks away, price is making a new 52 week high right into resistance on declining volume. Looking at the MACD, we have clear divergence with a crossover looking imminent. Plenty to be cautious about here.
