0HCB trade ideas

AA look for 52w high breakoutThree weeks ago this was rejected from the 52 week high, apparently we may have a current channel support. Look for bounce and 52w breakout in the following two weeks.

Alcoa $AA go up with very low risk My adivsor Marketmiracle generated a market entry signal at a price of 35.88 USD with a target of 39.00 USD for a potential profit of 8.70
It seems to me really a great opportunity considering that the stock now has a market sentiment very high or 0.91. I doubt he’ll think too long before moving in that direction.
Alcoa results in some sites to which I even refer below the fair value so I will hurry to enter into position

$AA Alcoa Corporation restart climbingMy Marketmiracle advisor generated an input signal for Alcoa Corporation at a price of 39.99 USD with target price 42.13 USD.
The graphical situation is effectively compatible with the signal of purchase and analyzing the curves of purchase on Market Miracle Viewer you notice as the buyers of Medium weight are returned to the purchase on the Stock.
I therefore consider it a good opportunity with a possible profit of about 5% in a few days.
This idea is based on a signal generated by the advisor Marketmiracle, scroll below to find a link to the page with the signals that the advisor generates.


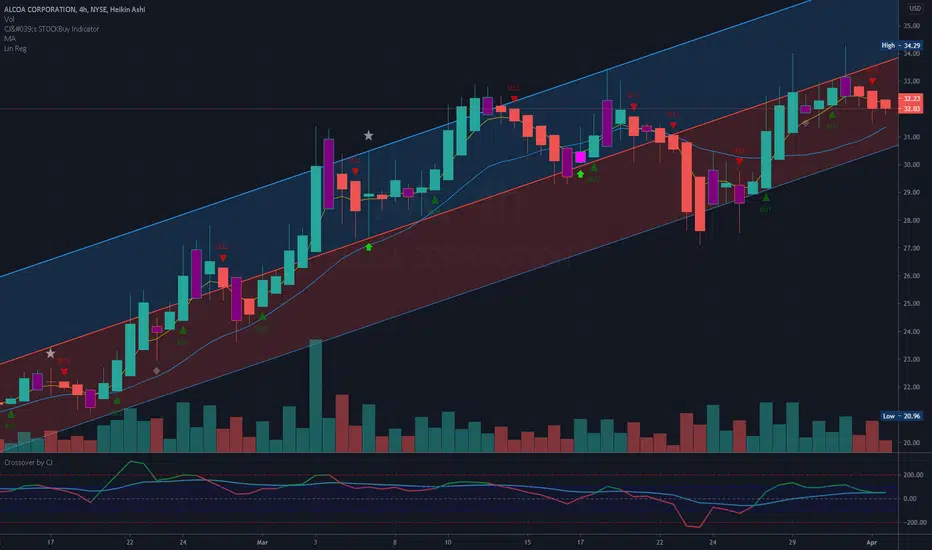
Broadening Formation with Short Base (AA)- Broadening formation from December 2020 to February 2021
- Top-bottom was 28-18
- Noticed breakout 28 in early March
- Short base and consolidation in March offered an entry point at 32 at top of the upper boundary
- Opened @32.37 on 03/26. It did not rally immediately but moved around 32
- Once it started to climb, AA went straight up to finish +34% profits
- Please note that it is hard to find other entry points for this type of pattern

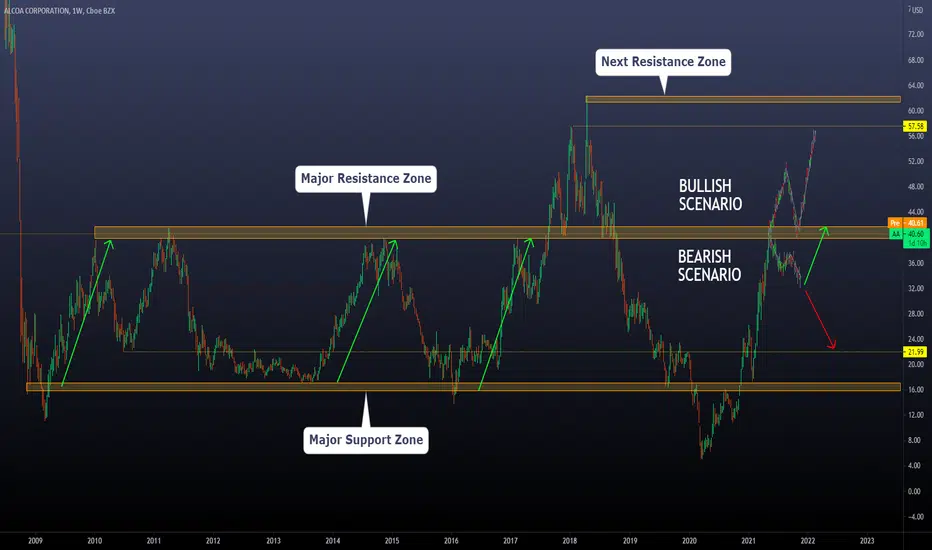
ALCOA has reached our Weekly Target. What's next?Today we will speak about ALCOA: In March, we posted the expected movement of the current trend (Link to related ideas). After 2 months, the price has already reached a major Resistance zone that has been working since 2010
Now we are asking the question. What's next?
To answer this, we will use the previous price information we have to develop possible paths for the price to take.
SCENARIO 1 (Bearish): The price is not able to make a clean break out of the resistance zone, and we have a Correction or the beginning of a new bear market. In this situation, we should expect a -20% movement between 100 and 150 days. IF the price cannot keep falling, we should be open to the idea that the correction was a break before the breakout of the resistance zone. Like the scenario, we saw between 2018 and 2018.
However, if the price keeps falling below the previous parameters, we may think that a new bearish trend will start with the first target at 22.20
SCENARIO 2 (Bullish): The price makes a clean breakout of the resistance zone reaching at least 45USD a share. IF that scenario happens, we will be waiting for a "Throwback," which is a retest of a broken level or structure, and the target for that movement will go from 57 to 61.
How to use this information): The main idea about creating possible paths is to start thinking about how you would trade certain assets IF the price reaches all your parameters. That allows you to do it calmly and professionally without being moved by your emotions. Patience is a great wealth creator.
Thanks for reading!
Alcoa: Chance for a Bearish Reversal A confluence of bearish indications
Alcoa's share price is currently probing the psychologically significant resistance level at 40.00, which serves as the upper boundary of a major accumulation range. The latter's lower end is represented by the support level at 17.00.
Breaking higher would prove quite difficult for the share price due to the massive selling pressure that is to be found just past the upper end of the range.
Despite the fact that Alcoa shares have been on the rise over the past 4 months, the continuation of the rally will find strong opposition around the major turning point at 40.00. The resistance is currently being crossed by the descending trend line (in red), which increases the likelihood of a bearish rebound occurring from the current level. Moreover, the 300-day MA (n purple) and the 200-day MA (in orange) are also advancing parallel to the resistance level, making it even less likely for the rally to continue uninterrupted. However, that is not to say that potential fakeouts to the 45.00-50.00 range are entirely impossible.
Meanwhile, the Stochastic RSI indicator is ringing the "overbought" bell as bullish bias reaches a climax. This could give bears more reasons to step up and increase the selling pressure at this swing peak, which would consequently support the emergence of a new correction.
The nearest support can be found around the 100-day MA (in blue), which can presently be found at 27.40. In other words, an imminent correction from the latest peak would entail a likely dropdown of more than $13 (32%) in the share price.
Alcoa's robust quarterly performance
The latest upswing was largely inspired by the strong earnings data that the mining giant posted recently. According to the findings of the earnings report for Q1:
Revenue grew to $2.87 billion, up from the $2.38 billion from one year ago
EPS (earnings per share) grew to $0.79, far surpassing the negative $0.23 EPS that were posted for the same period last year
Even still, the market has already had more than two weeks to price in this performance, and the "market excitement" factor that drove the hike is thus likely to start waning down soon.

WD GANN THE MARKETS ARE SET WHEN THEY START IT IS THE NATURAL LAW THAT THEY FOLLOW WE ARE PEOPLE THE VIBRATIONS FOLLOW DISTINCT ANGLES WITH ORDINANCES>> FROM THE PAST>> THE GUY WHO STUDIES THE PAST THE MOST>>> MAKES THE MOST

$AA Rising Wedge, chance for put then call profitAA forming a rising wedge which is usually bearish. I set an alert to let me know if it breaks down out of the rising wedge. If it breaks down, it'll first "hook" down and up quickly to confirm resistance and try to rise again. If it fails, it will "go" quickly downward to the next support level at ~25$ for a 33% gain on a short, more for a put option. Once it finds support and begins to reverse upward, there's a chance for a 64% gain on it's way to $37 (more for a call option).

Alcoa is on an upward channel.$AA on an upward channel.
Buy zone around $31
Stoploss around $29.
Infrastructure play.
Happy Trading, from CJ -- aka the greatest FURU.
To find out more about The Ultimate Stock Indicator on Tradingview, please check my public profile. 🚀🚀🚀🚀
AAAlcoa (NYSE:AA) was a big winner Friday, as the stock closed up $32 on decent volume. I feel that there will be a continuation move next week, but I want to see a close above $33 before I buy. There are several short term technical indications suggesting that AA could make a move to higher levels. Worth putting on the watchlist.


The weekly target for ALCOA CORPORATIONThis is a simple post, mainly for people holding this stock and want to have an idea of exit levels or what to expect in the coming weekly candlesticks.
-Our approach to any chart is straightforward. It is based on analyzing things that happened in the past in specific areas and then replicating those conditions to the present to understand how the price can evolve.
-In this case, since 2009, we can see a clear support zone at 16.00; every time the price reached that level, we saw huge bullish pressure. When the price went below that level, it didn't take too much time to see it above again. If the 16.00 level is an accumulation zone, where is the distribution zone?
-To answer this, we can use the same approach. 40.00 is a distribution zone since 2009 for Alcoa. Every time the price reached that level, we observed selling pressure. Even when the price went above that level, the price retreat first. As a final target for the movement we observe, we think 40USD is a great area to close setups and see if we have corrective patterns that can provide us information about more bullish pressure coming or see huge sell-offs like the ones that happened in the past.

$AA - $30 targetthis broke a nearly 3 year down trend
since then its performance has been strong
Playing options and commons on this with a target over $29 within the next month
let's see if it works out

AA- weekly chartby closing this week above 26.50 inverted H&SH patter will be confirmed
T 46.00
SL closing below 17.30

AA Long swingAA has had some recent huge sell off with volume appearing to absorb all those sold shares. Overall, I think this is looking quite bullish in the current channel it is in. Looking to scale out at different price levels. Also looks poised for a huge breakout on the larger timeframe bull flag its been in

ALCOA Corporation - harmonious growthA good bullish recovery.
The stock is going up in value.
I expect more growth.
Push like if you think this is a useful idea!
Before to trade my ideas make your own analysis.
Thanks for your support!


Month undecided Fib Descen channelndetermined which direction Monthly.
implied monthly lower movements, but showing potential higher movement.
Fibonacci retracement keeps making me think lower.
www.investopedia.com
Potential Ascending Wedge , but unclear due to the initial starting point.
this site makes me believe it will move lower yet.
www.babypips.com
Note the two lines similar to each other for the resistance lines reviewed from this link here:
www.dailyfx.com

AA Long Idea
Long AA idea.
MACD and RSI both flipping towards upside with strong support below.
Stops below bottom pink line at 17.19.
Looking for gap fill back up after earnings reaction.
Take profits when happy on the way up. Price targets pink lines above ideally where you would scale some out / exit runners.
Options: 3/19/21 or 4/16/21 CALLS
Stay close to the money if possible for best results.
NOT A FINANCIAL ADVISOR THESE ARE JUST MY IDEAS THAT I WANT TO SHARE WITH EVERYONE AS I CONTINUE TO IMPROVE MY TRADING.

AA Could provide nice gains if it stays above the SMA lineAA currently just crossed the SMA line which gives clues that stock is making a bullish push. However, we still need to wait for confirmation if it does indeed confirm this bullish run I know I will be getting it and looking to get out at $27 fairly easy. From the current price of $20.36 to $27 that is a 30% increase. This is mainly focused for short-term buyers looking to make quick gains but still this stock I think will be up nicely long-term. If you look left and look at the stocks past you can see the price can go much higher than $27 but I think $27 is the realistic price it could get up to. If this helps you in any shape or form please like the idea.
