0HOB trade ideas


Stochastic/MACD Divergence breakout of a falling wedgeStochastic divergence breakout of a falling wedge. There is also MACD divergence on this one, so I wanted to include that indicator. This one was posted to Twitter this week, but I think it's a great setup and deserves a spot on the watchlist.
Buy: 26.00
Target: 27.38 - 29.07 (5.31% - 11.81%)


HRB gap fill Longlong on this. after we break resistance gap fill. initial pt 25. leaps will do the job

pennies to thousands long term short candidateif any candidate with simple tax wins revenue weak
below weekly 200 ma
macd crossed see our book on amazon same name psychology of clearing of past trading mistakes
rsi week
rbi and percent r bottom
money flow weak

HRB LONG. Tax season + Fundamental chart strength. Hi there. I don't really trade stocks anymore, but I like to break down the charts sometimes to just get some variety and change of pace when I am bored. I noticed this equity is approaching a nice possible buy zone. You can just buy at the line it's at now, and then there are two lower buy levels. I also marked out the take profits

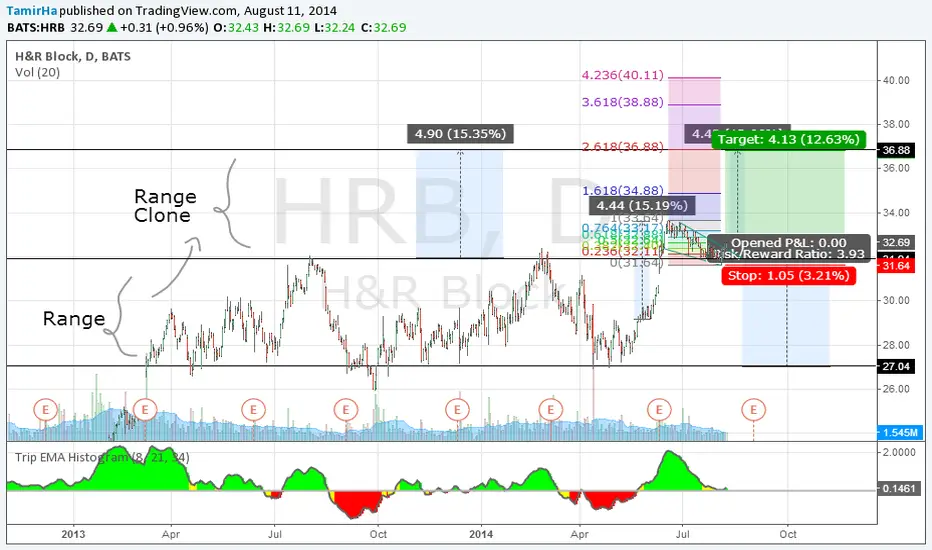
HEB 3 reasons why it could go higherhere is why i think HRB is going higher
1. price broke out of range 27$-32$ in a decisive move and high vol
2. price successfully tested 32$ as support and rebound creating a bull wedge and broke resistence line friday
3. trip EMA oscillator is turning bullish again which led in the past to nice moves
target of range fib extension and small bull flag is around 37$ (TP at 36.5-36.8)
P.S
thanks to @BreakOutArtist check his idia on related
GL
HRB Flag Pattern Confirmed, Aiming At Least $36.00 (+10%)Starting from 2013, price has risen sharply, from $19.00 to as high as $32.00.
However from August 2013 to June 2014, price has been consolidating between $26.00 - $32.00, forming a potential flag pattern.
On 11 June 2014, price has broken out of the $26 - $32 consolidation, confirming the flag pattern formation.
This breakout went as high as 33.45, followed by retracement towards $32.00.
We note that there is support buying at $32.00. This indicates that the initial breakout to $33.45 is unlikely to be bull trap/ false breakout and traders are building up long positions around $32.00.
We project that price has finished retracing and is about to continue to rise even higher to complete the Flag Pattern.
Theoretical Price Targets:
a) $36.00 {Height of Consolidation + Breakout Level = (32-28) + 32 = 4+ 32 =36}
b) $44.76 { Height of Flag Pole + Breakout Level = (32-19.24) + 32 = 44.76
c) $40.85 { Elliott Wave 3 = (1.618 x Wave 1) + Breakout = 1.618 x (33.45 - 27.93) + 32.00 = 8.85 + 32= 40.85}
Reasonable Stop Loss: Below $32.00.
Time Limit: The breakout will most likely occur from now until 03 Sep 2014. This idea will not be valid after 03 Sep 2014
Risk: There is still a possibility of a false breakout, which will be defined if price closes below $32.00.
Reference on Flag Pattern:
thepatternsite.com
Like it, Share it, Follow it~
Trading View: BreakOutArtist
StockTwits: stocktwits.com/BreakOutArtist
Twitter: twitter.com/BrkOutArtist
TradeHero: BreakOutArtist
Facebook: www.facebook.com
Explore TradingView for more Trade Ideas> www.tradingview.com

Still shortThis market is primed for another hard drop. Who is buying up this market? Volume low across board.
